

Quota coverage planning means calculating how much pipeline and headcount each segment needs to hit its assigned quota, using that segment’s own closed-won win rate rather than a blanket multiple. The single most important move is replacing universal rules like “3x coverage” with segment-specific math tied to capacity constraints. Before anything else, pull the last four quarters of closed-won win rate by segment. That number drives everything downstream.
TL;DR:
- Rely on segment-specific data, such as last four quarters of win rates, to accurately calculate pipeline coverage ratios for each segment.
- Avoid using a universal 3x coverage rule; instead, adjust multiples based on each segment’s actual win rate to prevent over- or under-estimation.
- Ensure quotas are designed in conjunction with territory potential, considering account distribution, account potential, and territory scoring to prevent capacity or fairness issues.
- Monitor pipeline health weekly by segment, assessing aging, concentration, and win rate shifts to identify coverage gaps early and differentiate between pipeline and quota coverage.
- Recalculate coverage models quarterly or when market conditions change significantly, and present detailed segment-level data to leadership to detect risks swiftly.
Table of Contents
- What Is Quota Coverage vs Pipeline Coverage?
- Why Quotas and Territories Must Be Designed Together
- How Do You Calculate Required Coverage Per Segment?
- Top-Down, Bottom-Up, or Hybrid: Which Quota Allocation Method Fits?
- Territory Design Patterns That Preserve Coverage
- How Does Ramp Time Affect Quota Coverage?
- How Do You Monitor and Correct Coverage Gaps?
- Crono’s Operational Playbook for Coverage Planning
- The Gap Between Coverage Theory and Coverage Practice
- Pilot Quota Coverage Planning With Crono
- Sources
- FAQ
What Is Quota Coverage vs Pipeline Coverage?
The two terms get used interchangeably, and that habit causes real planning damage. Quota coverage is a planning artifact: the sum of assigned quotas divided by the company’s total revenue target. If your reps carry combined quota moderately above the company target, your quota coverage ratio is above 1.0x. It’s set once a quarter or once a year, and it belongs to sales leadership and RevOps.
Pipeline coverage is an execution metric: open qualified pipeline divided by the remaining period goal. It moves daily as deals get created, pushed, or lost, and it belongs to frontline managers running weekly forecast calls. Confusing the two is one of the more common failure points in revenue planning, because a team can look fully covered on paper (quota coverage) while its actual pipeline coverage is dangerously thin heading into the last month of the quarter.
Common counting mistakes that blur the line between the two:
- Treating a “quota” and a “target” as the same thing, when a target is often the aspirational number and quota is the contractual, comp-linked figure a rep is measured against.
- Counting stale pipeline (no stage, amount, or close-date movement in months) as if it were live coverage.
- Using stage-weighted or “probability-adjusted” pipeline values that mask how much raw coverage actually exists.
Get these definitions straight and you can assign the right owner and the right review cadence to each metric instead of arguing about which number is “true.”
Why Quotas and Territories Must Be Designed Together
Designing quotas in a spreadsheet disconnected from territory maps is how coverage gaps get baked in before the quarter even starts. Territory granularity, account assignment rules, and named-account lists all change how much realistic quota a given rep can carry, and none of that shows up if quota setting happens in isolation.
Three things go wrong when quota and territory design run on separate tracks:
- Fairness breaks down. A rep assigned a territory with three enterprise accounts and a rep assigned twenty small accounts cannot carry the same quota, even if both territories show similar total addressable revenue on paper.
- Composition risk hides inside a healthy-looking average. A company-wide quota coverage ratio modestly above 1.0x can mask one segment significantly under-covered and another significantly over-covered. Aggregate numbers flatter leadership decks and hide exactly the segments about to miss.
- Capacity gets double-counted or missed entirely. Without linking quota to territory potential, RevOps often either assigns quota to accounts nobody owns yet or leaves high-potential accounts under an existing rep’s plate with no corresponding quota lift.
The fix is procedural, not conceptual: run territory scoring and quota allocation in the same planning cycle, using the same account data. When account scoring, territory boundaries, and quota bands come out of one model instead of three disconnected exercises, coverage math actually holds up when the quarter gets hard. Segment-level reporting rows, not just a blended company number, are what let leadership see composition risk before it becomes a Q4 surprise.
How Do You Calculate Required Coverage Per Segment?
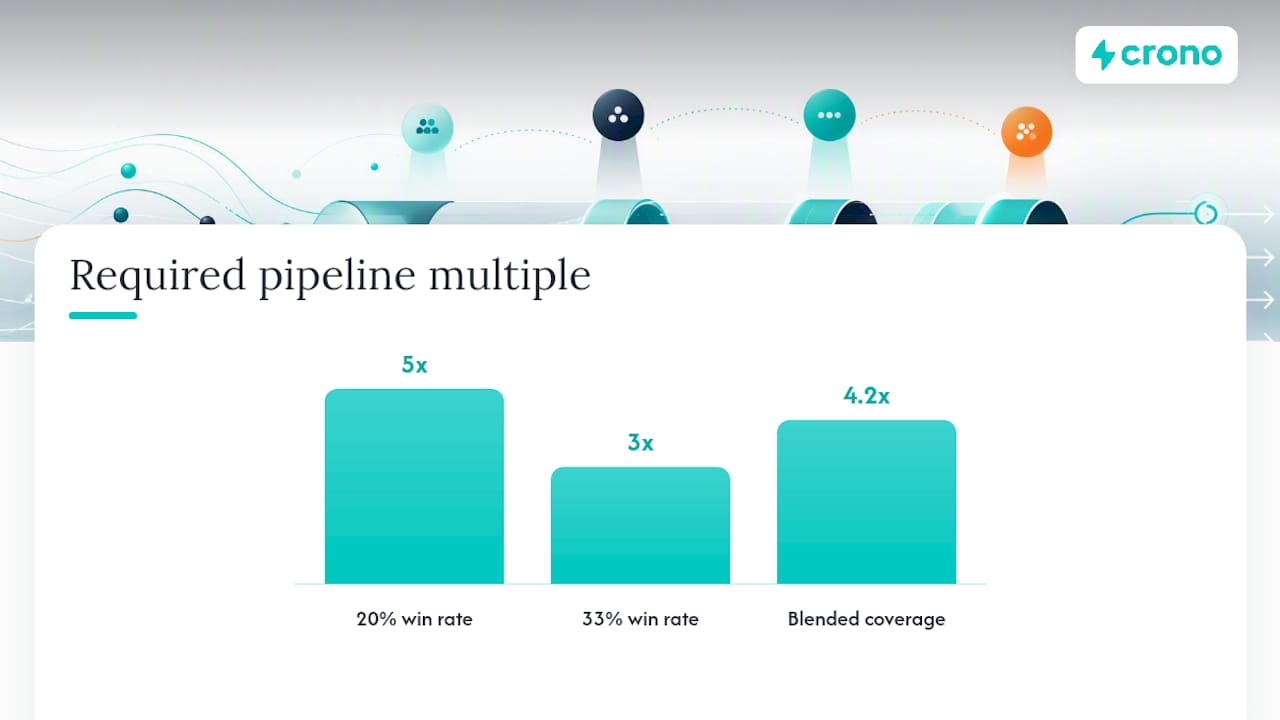
The base formula is simple: required pipeline = quota ÷ closed-won win rate. If a segment’s win rate is 20%, that segment needs 5x its quota in qualified pipeline. If another segment converts at 33%, it only needs 3x. Applying a single company-wide multiple to both segments guarantees one of them is set up to miss, which is exactly the trap a universal 3x rule creates.
Three adjustments make the raw formula usable in practice:
- Strip out stale opportunities. Anything with no stage, amount, or close-date change in the trailing 12 months should not count toward live coverage, since it inflates the ratio without inflating real chances of closing.
- Reprice open opportunities to the closed-won average. Compute a segment-level ratio of average closed-won deal value to average open deal value, then apply that ratio to adjust the open pipeline figure so it reflects realistic deal sizes rather than optimistic ones logged by reps.
- Adjust for in-period close share. Not all qualified pipeline closes within the quarter it’s measured. If historically only 60% of a segment’s open pipeline closes in the period it’s counted, factor that into the required multiple.
Here’s a worked example at the segment level:
Pro Tip: Never report only the blended row. A CRO looking at “4.2x, we’re fine” would miss that enterprise is running nearly double the coverage need of SMB, and if enterprise pipeline is thin, the blended number is lying to the room.
Win rates shift with the market, so recalculate this table at least quarterly using trailing four-quarter data. A win rate calculated on year-old deals tells you what used to be true, not what’s true now.
Top-Down, Bottom-Up, or Hybrid: Which Quota Allocation Method Fits?
Top-down allocation starts with the company revenue target and divides it down through segments, teams, and reps based on historical share or headcount weighting. It’s fast and it’s the only realistic option early in a fiscal year when board targets land before territory data is finalized. Its weakness is that it can assign quota to a rep whose actual territory potential doesn’t support the number, which is how you get a “stretch” quota that quietly demoralizes a whole segment.
Bottom-up allocation starts with each rep or territory’s account-level potential, scored using firmographic and signal data, and rolls those numbers up into a company total. It adds real signal because it reflects what’s actually in each territory, but it runs the risk of sandbagging if reps know their numbers become their quota.
Hybrid reconciliation is the practical answer most mature RevOps teams land on:
- Leadership sets the top-line target first.
- Segment and territory leaders build a bottoms-up potential estimate independently.
- The two numbers get reconciled in a dedicated governance meeting, using a two-column spreadsheet that flags variances over a set threshold (commonly 10 to 15%) for discussion rather than automatic override.
- Persistent gaps get escalated, not split down the middle by default.
Before finalizing and communicating quotas, run through this checklist:
- Confirm every named account has exactly one quota owner, with no overlap and no orphaned accounts.
- Document the win rate and multiple used for each segment so reps can see the math, not just the number.
- Flag any territory where quota grew faster than territory potential and explain why.
- Communicate changes with the reasoning attached, not just the new figure.
Reps who understand the formula behind their number argue with the math, not with you personally. That alone cuts the friction of quota season by more than most leaders expect.
Territory Design Patterns That Preserve Coverage
Territory structure determines whether your coverage math holds up once accounts get assigned to actual humans. Three models dominate:
- Named-account territories, common in enterprise motions, assign specific companies to specific reps regardless of geography. This preserves relationship continuity but requires careful scoring so no rep ends up with a quota disproportionate to their named list’s realistic potential.
- Geographic territories work well for SMB and mid-market motions with high account density, where travel time and time zone alignment matter more than individual account depth.
- Segment-based territories split by company size, industry vertical, or product line, letting reps specialize and letting quota reflect the different win rates each segment carries.
Whichever model you pick, score territory potential using a consistent formula (typically a blend of firmographic fit, historical close rates in that segment, and current pipeline density) and translate that score directly into a quota band, not a fixed number pulled from last year.
Parent-child accounts and overlay roles are where coverage math quietly breaks. A parent account with subsidiaries split across two reps needs an explicit rule for which quota gets credit for expansion revenue, or you’ll end up double-counting the same deal in two people’s coverage math. Overlay reps (specialists who support a deal without owning the account) should carry a partial quota credit defined before the quarter starts, not negotiated after a deal closes.
Operationally, this is where mapping and assignment-rule tooling earns its keep. Publishing territory models and exporting assignment rules directly into the CRM keeps the territory “live” instead of living in a slide deck nobody updates after February. Platforms built around scenario modeling and interactive territory mapping let you test a reassignment before you announce it, which matters when one rep leaving mid-quarter forces you to redistribute their book without blowing up everyone else’s coverage ratio.
How Does Ramp Time Affect Quota Coverage?
A new rep does not carry full quota on day one, and pretending otherwise is one of the fastest ways to manufacture a coverage gap that looks fine in a hiring plan and falls apart in Q3. Sales capacity models fold ramp curves and expected attainment directly into headcount planning, rather than treating a new hire as a full quota-carrying unit the moment they sign an offer letter.
Build ramp into the coverage model with a few concrete steps:
- Model expected attainment by month for the first two to three quarters (commonly 25 to 50% of full quota in ramp months, scaling up), rather than assuming instant productivity.
- Size an over-assignment buffer into total team quota based on your historical ramp curve and attrition rate, so a slower-than-expected ramp doesn’t silently create a coverage hole.
- Fold ramp and attrition into the buffer at planning time rather than trying to patch a capacity gap mid-quarter. Hiring and ramp are long-lead-time levers you cannot compress after the fact.
- Reflect open, unfilled seats in your coverage ratio as zero-capacity slots, not as quota already covered, so the leadership view doesn’t overstate what the team can actually deliver.
Because hiring and ramp take months, not weeks, most teams need to start the requisition process well before the capacity gap actually shows up on a forecast. Crono’s sales capacity planning resource breaks down exactly how many months of lead time different roles typically require, and the SDR capacity planning framework walks through sizing buffers for entry-level ramp specifically.
How Do You Monitor and Correct Coverage Gaps?
Weekly monitoring should track four things: pipeline coverage by segment (not just company-wide), pipeline aging, concentration (how much of the segment’s coverage sits in two or three large deals versus spread across many), and any shift in the trailing win rate that would change the required multiple.
When a gap shows up, run gap analysis in this order:
- Calculate the shortfall precisely. Compare current adjusted pipeline against the segment’s required coverage figure, not the blended company number.
- Simulate two or three corrective scenarios before choosing one: reallocating accounts from an overcovered segment, accelerating specific late-stage deals, adding headcount, or, as a last resort, adjusting the quota itself.
- Choose the lever based on time horizon. Reallocation and pipeline acceleration can move numbers within the current quarter. Hiring cannot; it’s a next-quarter or next-half fix.
- Set an action threshold in advance (for example, any segment tracking below 80% of its required coverage by the midpoint of the quarter triggers an automatic review) so corrective action isn’t a judgment call made under pressure in week 10.
Pro Tip: Draft the communication template for a quota realignment before you need it. A rep who hears “your quota isn’t changing but three new accounts are being added to your book” reacts very differently depending on whether that message comes with the coverage math attached or arrives as a surprise on a Monday call.
Preserving seller trust during any realignment comes down to showing the same formula you used to set the original quota. If reps never saw the math the first time, a mid-quarter adjustment feels arbitrary no matter how justified it actually is. For teams whose SDR segment specifically is missing coverage targets, this breakdown of common causes and fixes is a useful companion to the gap-analysis steps above.
Crono’s Operational Playbook for Coverage Planning
Running this model manually across multiple segments, each with its own win rate, stale-pipeline rules, and ramp curve, is a heavy lift for a lean RevOps team; partnering with a Saas Seo Agency can help scale operations efficiently. A sales execution layer can support the underlying data work: enrichment and buying-signal data help keep account and territory scoring current, while workflow automation handles the repetitive parts of flagging stale opportunities and routing reassigned accounts to the right rep without manual CRM cleanup.
Two Crono resources map directly onto the sections above: the sales capacity planning guide for building ramp and hiring lead time into your coverage buffers, and the SDR ramp-time playbook for shortening time-to-productivity assumptions in your model.
Before running a pilot, confirm four things: clean trailing four-quarter win-rate data by segment, a defined stale-pipeline rule, sign-off from segment leaders on the reconciliation process, and a target early metric (commonly, whether reallocated territories show pipeline coverage improvement within one full sales cycle).
The Gap Between Coverage Theory and Coverage Practice
It’s what the math produces the moment you calculate coverage from actual closed-won win rates instead of borrowing a number from a sales blog.
The bigger failure isn’t the formula, though. It’s that most teams calculate coverage once a year and never touch it again, even as win rates drift with market conditions, competitive pressure, or a shift in deal size. A model that isn’t recalculated quarterly is a snapshot of a market that no longer exists by the time anyone acts on it.
If you take one thing from this: stop defending a blended company-wide coverage number in leadership reviews. Report the segment rows. That’s where the actual risk lives, and it’s the one habit that separates teams who catch a coverage gap in week six from teams who discover it in week twelve, when there’s no time left to fix it.
Pilot Quota Coverage Planning With Crono
The data work that segment-level coverage planning actually requires can involve enriched account data, buying signals, and workflow automation running inside a unified execution layer, instead of scattered across a CRM export and multiple spreadsheets. That matters most in week six of a quarter, when someone needs to know which segment’s coverage is drifting without waiting for a manual pull.
A practical next step is to pilot the model on one segment first: connect your CRM data, run the closed-won win rate calculation for that segment inside Crono, and test a reallocation scenario before committing to it company-wide. If you’re also scaling the AI-driven prospecting work that feeds new pipeline into that coverage math, the Agentic Sales Engine credit plans are worth reviewing alongside your rollout. To see full plan details and pricing, visit the Crono pricing page or request a demo to walk through your own segment data with the team.
Sources
The coverage math in this article draws on pipeline coverage ratio methodology, quota versus pipeline coverage definitions, and sales capacity planning frameworks. Reviewing them directly helps you replicate the formulas against your own segment data.
- Quota Coverage vs Pipeline Coverage | ORM
- Pipeline Coverage Ratio: Targets and How to Improve
- Pipeline coverage analysis (Rework resources)
FAQ
What Is a Good Quota-to-Pipeline Coverage Ratio?
There is no universal good ratio. The correct target equals 1 divided by the segment’s closed-won win rate, so a segment converting at 25% needs roughly 4x coverage, while a segment converting at 18% needs closer to 5.6x. Calculate it per segment, not company-wide.
Is It Good If You Reach 100% of Your Quota?
It says nothing on its own about whether the underlying quota coverage ratio for your segment was set realistically, which is why leadership should review coverage assumptions alongside attainment.
Can You Give an Example of a Quota?
A quota is the specific revenue or unit number a rep or team is contractually measured against for compensation purposes. It differs from a broader company target because it’s the individualized, comp-linked figure tied to a single rep’s book.
What Is the Difference Between a Target and a Quota?
A target is typically the company or team-level revenue goal set by leadership, while a quota is the specific number allocated down to an individual rep or territory that sums up to (or slightly above) that target. Quotas are usually tied to compensation; the overall target often is not tied to any single person’s pay.
How Often Should You Recalculate Quota Coverage?
Recalculate at least quarterly, using trailing four-quarter win-rate data by segment, since win rates shift with market conditions and a stale calculation misrepresents current risk. Segments with fast-changing deal sizes or new competitive pressure may warrant a monthly check.
