

The most useful activity benchmark for a US outbound team right now is the 2025 Bridge Group research: a median SDR logs 112 activities a day, split across calls, emails, LinkedIn messages and texts. But that number is a reference point, not a quota. This guide gives you the benchmarks that are worth knowing, shows how they change by channel and motion, and explains how to turn them into targets tied to meetings and pipeline instead of busyness.
TL;DR
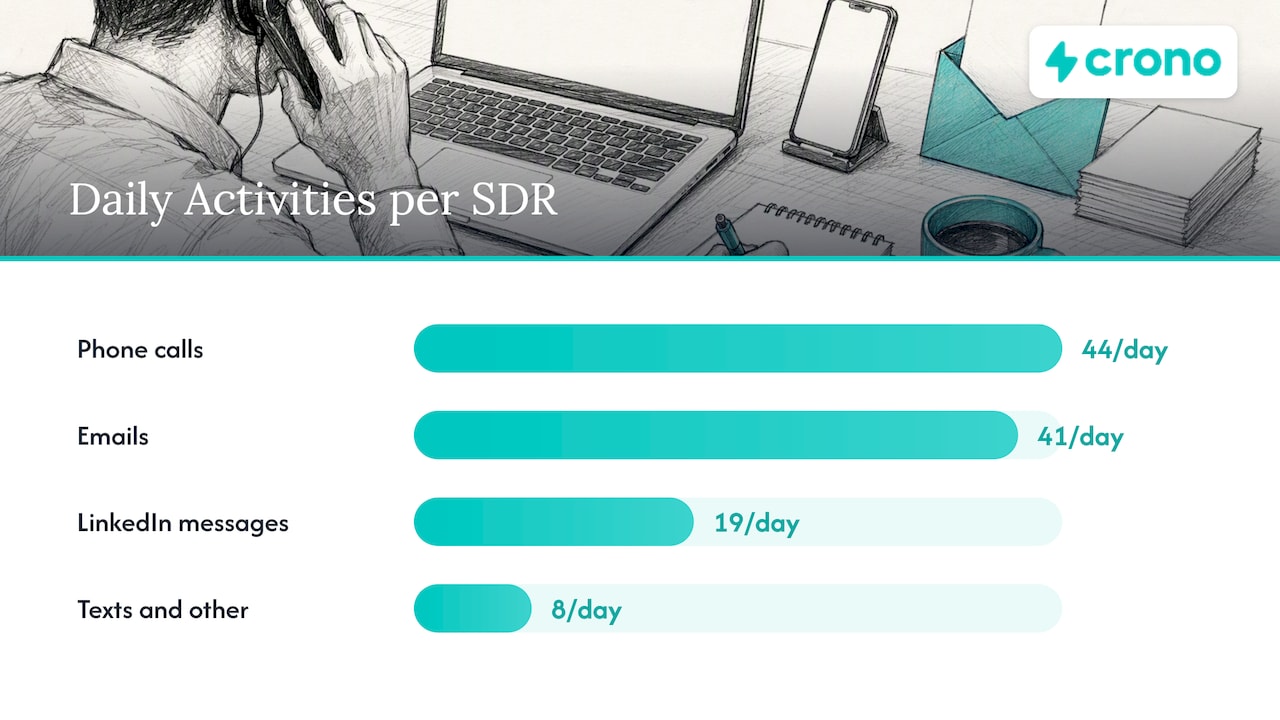
- The 2025 Bridge Group median for SDRs is 112 daily activities: 44 calls, 41 emails, 19 LinkedIn messages and 8 texts or other touches.
- Quality conversations matter more than raw volume: SDRs average 4.1 a day, and phone-centric teams average 4.6.
- Set targets backward from your meeting or revenue goal, then check them against your own conversion and reply data.
- Track an activity only if raising it would plausibly move more deals forward. Pair every count with its downstream outcome.
- Review targets on a regular schedule. They are working assumptions, not permanent quotas.
Table of Contents
- What activity metrics measure (and what they don’t)
- US benchmarks for SDR and BDR activity
- How benchmarks change by role, motion and channel
- Why raw activity counts mislead
- How to set activity targets from your own numbers
- Build a benchmark scorecard
- Common benchmarking mistakes
- Our perspective
- Put your benchmarks to work with Crono
- FAQ
- Sources
What activity metrics measure (and what they don’t)
Sales activity metrics count what sellers do: calls, emails, LinkedIn invitations, follow-ups, meetings, demos and proposals. Outcome metrics count what those actions produced: conversion and win rates, closed deals, revenue, quota attainment, deal size and cycle length. NetSuite’s explanation of sales metrics draws the same line, treating calls made as activity data and conversion rates, average deal size and sales-cycle length as outcome data.
The practical difference is timing. Activity is a leading indicator: you see it this week and can change it this week. Outcomes lag, sometimes by a full sales cycle. That makes activity the lever a manager can pull, and also the number most easily gamed. A rep can send 80 emails that nobody reads and still look “on target.”
A common set of B2B activity metrics, as Pipedrive’s sales metrics guide lists them, includes:
- Calls made
- Emails sent
- LinkedIn invitations
- Social interactions
- Follow-ups
- Demos held
- Proposals sent
Benchmarks give you a way to sanity-check these counts against what comparable teams do. They do not tell you what your team should do. For that you need your own funnel math, covered below.
US benchmarks for SDR and BDR activity
The strongest recent source for outbound activity in North America is the 2025 Bridge Group SDR research report. It reports a median of 112 total activities per SDR per day.
| Channel | Median daily activity per SDR (2025) |
|---|---|
| Phone calls | 44 |
| Emails | 41 |
| LinkedIn messages | 19 |
| Texts and other interactions | 8 |
| Total | 112 |
Two points about reading this table. First, it is a median across many teams, so half of the teams in the study sit above it and half below. Second, the mix matters as much as the total. Nearly 40 percent of the typical SDR day is phone, and a little over a third is email, with LinkedIn and texts filling the rest.
Older practitioner benchmarks point the same way. Gradient Works notes that outbound SDRs typically make 40 to 50 calls and send 10 to 40 emails a day. Email volume is the widest range, which fits what most managers see: teams with strong sequencing and tight lists send fewer emails than teams that blast broad lists.
Quality conversations: the benchmark that matters most
The same Bridge Group report points to a rebound in quality conversations, with SDRs averaging 4.1 a day. Phone-centric teams average 56 dials and 4.6 quality conversations daily. That gives you a useful ratio to hold up against your own data: roughly one quality conversation for every 12 dials on a phone-led motion.
If your reps make 56 dials and have one real conversation, the problem is not effort. It is list quality, timing, number accuracy or opening line. If they have five conversations but few meetings, the problem moves downstream to qualification and the ask.
Speed to lead
Response time is an activity metric that many teams never measure. Research cited by Gradient Works says only 7 percent of companies respond to new leads within five minutes, and the average response time is 42 hours. If you respond in minutes, you are ahead of nearly everyone on this metric without making one extra dial.
How benchmarks change by role, motion and channel
A single “activities per day” figure hides large differences. Before you compare your team with any benchmark, match on these four variables.
Role
SDRs and BDRs work high-volume, short-touch motions, so the benchmarks above apply to them. Account executives run fewer, deeper activities: discovery calls, demos, proposals and executive meetings. Counting an AE’s emails against an SDR benchmark makes little sense. For AEs, track demos held, next steps scheduled and multi-threading (how many stakeholders are engaged per deal).
Sales motion
Inbound-led teams spend more of the day on follow-up and speed to lead. Outbound teams spend it on first touches and cadence work. Account-based teams run far fewer touches per day on far fewer accounts, with heavier research per touch. A phone-centric team and an email-and-LinkedIn team will each look “low” on the other’s channel, and both can be right for their market.
Channel mix
The Bridge Group split shows that most teams run several channels at once. Our multichannel outreach playbook covers why two to four channels tend to work better than one, and timing in multichannel strategies covers how to space them. When you benchmark, compare total touches per prospect and per day, not only email volume.
Email specifically
For email, the output metric is the reply rate, not sends. Our breakdown of cold email reply rate benchmarks shows the spread between weak and well-run programs and what separates them. If you are tightening the basics first, a solid grounding in email marketing fundamentals helps you decide which email numbers deserve a place on your dashboard.
Why raw activity counts mislead
Zendesk makes a point that holds up in practice: counts of calls and emails tell you about pace, but the meaningful question is what those activities produce. An email can be opened, clicked, replied to, answered with a next step, declined, or answered with “not now.” Each of those outcomes is different information, and “sent” captures none of them.
Salesscreen offers a clean test for what belongs on a dashboard: track an activity only if raising it, with everything else held equal, plausibly moves more deals forward. Applied honestly, that test removes a lot. “Emails sent” often fails it, while reply rate passes. Method.me reaches the same conclusion from a CRM angle: high volume does not replace quality, so tracking should center on conversion rates.
The pattern across these sources is consistent. Keep the volume metric, because it shows pace and capacity. Then pair each volume metric with a conversion metric:
| Activity (input) | Paired outcome (conversion) |
|---|---|
| Dials | Connect rate, quality conversations |
| Emails sent | Reply rate, positive reply rate |
| LinkedIn invitations | Acceptance rate, conversations started |
| Conversations | Meetings booked |
| Meetings held | Opportunities created |
| Demos held | Next step agreed, proposals sent |
If a rep’s volume is high and the paired conversion is low, coach the quality of the touch. If volume is low and conversion is healthy, look at capacity, tooling and list supply. Our guide to why SDR teams miss quota goes deeper on that diagnosis.
How to set activity targets from your own numbers
GTMnow’s guidance on SDR goals is to derive activity targets from a revenue or meeting goal and then check them against conversion, reply and touch-to-outcome data. It also advises reviewing and adjusting targets rather than freezing them as quotas. Here is that approach as a working sequence.
- Start with the outcome. Decide how many qualified meetings or opportunities each rep or the team needs per month. Work back from the revenue target using your own win rate and average deal size.
- Measure your conversion ratios. For the last one to three months, calculate touches per connect, connects per meeting and meetings per opportunity, by channel.
- Back-solve the activity. Divide the meeting goal by the meeting-per-conversation rate, then the conversations by the conversation-per-touch rate. The result is the touches needed per rep per day.
- Compare with the benchmark. Place the result against the Bridge Group medians. If your model says 200 activities a day and the market median is 112, either your conversion is weak or the target is unrealistic. Fix the first before pushing the second.
- Set a range, not a point. A floor for minimum healthy pace and a stretch figure work better than one hard number.
- Review on a schedule. Revisit targets monthly or quarterly as list quality, messaging and channel mix change.
A worked example
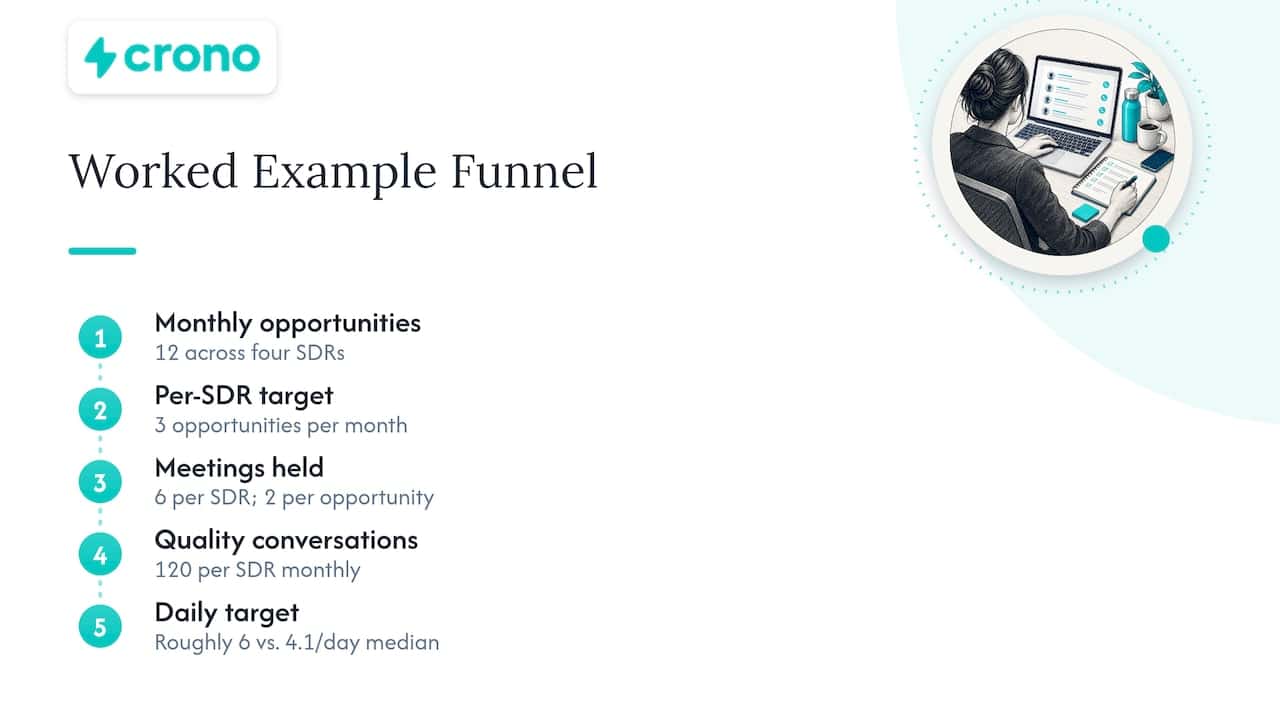
Suppose a team needs 12 new opportunities a month from a pod of four SDRs, so three each. Say your history shows two meetings held per opportunity created, and one meeting booked for every 20 quality conversations. That implies six meetings per SDR, about 120 quality conversations per SDR per month, or roughly six per working day. The Bridge Group average of 4.1 a day tells you this target is above the median, so you would check whether list quality or the call mix can support it, or whether the conversion assumptions are too pessimistic. The figures here are illustrative; swap in your own ratios.
Build a benchmark scorecard
A scorecard that a Head of Sales or RevOps manager can review weekly should be short. Include:
- Pace metrics: total activities, calls, emails and LinkedIn touches per rep per day.
- Quality metrics: connect rate, quality conversations per day, reply rate, positive reply rate.
- Speed metrics: time to first response on inbound leads.
- Conversion metrics: meetings booked per conversation, opportunities per meeting, pipeline created per rep.
- Hygiene metrics: fields completed and stale deals. Our pipeline hygiene audit lists four fields to check weekly.
Show each metric against three reference points: the external benchmark, the team’s own trailing average and the individual’s trend. A rep who is below median but improving is a different conversation from one who is above median and flat.
Common benchmarking mistakes
- Comparing across motions. An enterprise ABM team measured against a high-velocity SDR benchmark will always look weak.
- Treating a median as a target. Half of teams sit below it, and many of them hit their numbers.
- Using old data. Channel mix shifts. A benchmark from 2014 reflects a different buyer inbox than one from 2025, so prefer recent research.
- Rewarding volume alone. Reps respond to what you measure. Pay and recognize on meetings and opportunities, with activity as the diagnostic.
- Ignoring data quality. Bad emails and wrong numbers depress every conversion rate, and no benchmark will surface the cause.
Our perspective
We see the same pattern with the teams we work with: activity is rarely the problem, and execution is. Reps open five tabs to research one account, copy data between a CRM and an engagement tool, and decide by feel who to contact next. The 112-activity median looks like a volume target, but a large share of a rep’s day goes to the work around the activity.
That is why we built Crono as a sales execution layer rather than another dashboard. It connects the CRM and the tools a team already uses, brings buying signals and enrichment into one workflow, and lets people and AI agents split the repetitive work. When prioritization comes from signals, and drafting and sequencing are automated, the same rep can spend more of the day on quality conversations, which is the benchmark we would watch above all others.
Our advice: pick three or four paired metrics, set targets from your own funnel, and use benchmarks to challenge assumptions instead of to set them. If an activity count goes up and meetings do not, change the activity.
— Alex
Put your benchmarks to work with Crono
Benchmarks only help if the data behind them is trustworthy and the follow-through is consistent. Crono brings your outreach across LinkedIn, email and calls, contact enrichment and pipeline views into one place, so activity and its conversion sit side by side. Plans start at €79 per month per seat for Pro and €119 per month per seat for Ultra, and teams that want AI agents running prospecting workflows can look at the Agentic Sales Engine, from €99 per month for 10,000 credits. See the current options on our pricing page or explore the Agentic Sales Engine.
If you want to see how agents handle repetitive execution before you commit, our guide to deploying AI sales agents in B2B sales walks through the setup.
FAQ
How many activities per day should an SDR do?
The 2025 Bridge Group research shows a North American median of 112 total activities a day, including 44 calls, 41 emails and 19 LinkedIn messages. Treat that as a reference point. Your own target should come from your meeting goal and your conversion rates, and quality conversations (about four a day on average) are a better check than total touches.
What is a good number of calls and emails per day?
Gradient Works reports that outbound SDRs typically make 40 to 50 calls and send 10 to 40 emails a day. The Bridge Group median sits at 44 calls and 41 emails. Email has the widest range, so judge it by reply rate rather than volume.
Are activity metrics or outcome metrics more important?
You need both. Activity metrics are leading indicators that a manager can change this week, while outcomes such as win rate, revenue and cycle length show whether the activity worked. Pair each activity with the outcome it should produce so you can tell busy reps from productive ones.
How often should we update activity targets?
Review them on a regular schedule, such as monthly or quarterly, and whenever your list, messaging or channel mix changes. Targets derived from conversion data should move as that data moves. They are working assumptions, not permanent quotas.
Sources
- Sales Metrics: How, Why, and 20 Metrics You Should Be Tracking (NetSuite)
- Sales metrics: Definition, examples and recommendations (Pipedrive)
- SDR Models, Motions & Metrics: 2025 Research Report (The Bridge Group)
- Benchmarks for metrics that matter to an SDR or BDR team (Gradient Works)
- Why activity metrics are killing your sales (Zendesk)
- The Activity-Based Selling Playbook (Salesscreen)
- Your Guide to Sales Activity Tracking (Method)
- How To Set Sales Goals For Your SDRs & Determine Their ROI (GTMnow)
