
Sales capacity planning converts a revenue target into a specific number of productive rep-equivalents and a timed hiring plan that accounts for attainment, ramp, and attrition. The output is not a headcount guess. It’s a rep-year requirement and a hiring calendar you can defend to your CFO. Start with a real capacity model this quarter, backtest it against last year’s actual roster, and adjust before you post a single job requisition.
TL;DR:
- Success relies on accurately modeling ramp times and attrition rates, which can extend lead times and impact hiring schedules significantly.
- Proper pipeline coverage should match sales cycle lengths, requiring 2 to 6 times the revenue target in qualified pipeline depending on segment complexity.
- Starting recruitment 5 to 6 months in advance is crucial, especially when considering combined hiring and ramp durations for new reps.
- Validating the capacity model against last year’s actual data helps correct overestimations caused by using quota instead of attainment.
- Managing territory design and support roles effectively prevents capacity constraints from undermining the recruiting and planning process.
Table of Contents
- What Is Sales Capacity Planning, and Why Does It Matter?
- What Inputs Actually Drive the Model?
- How Do You Turn the Model Into an Actual Hiring Calendar?
- Worked Example: Turning a Revenue Target Into a Hiring Number
- Does Your Territory Design Actually Support the Model?
- How Do You Validate the Plan and Avoid the Most Common Mistakes?
- What Tools and Templates Make This Easier to Run?
- What Do Practitioners Get Wrong Most Often About This?
- Put the Capacity Model to Work With Crono
- Sources
What Is Sales Capacity Planning, and Why Does It Matter?
Sales capacity planning is the process of forecasting how many reps, of what type, you need to hit a revenue number, based on how much productive selling capacity each rep actually delivers, according to Salesforce.
The distinction matters because most sales leaders build their plan backward. They take a revenue target, divide by average quota, and call it a hiring number. That math ignores three things that determine whether reps can actually produce: how long it takes a new hire to ramp to full quota, what percentage of reps actually hit quota in a given year, and how many people will quit or get managed out before the year ends. Skip those three variables and your “12 new AEs” plan quietly becomes a 8 or 9 rep reality by Q3, with a revenue shortfall nobody saw coming until it was too late to fix.
Building the capacity model, step by step
A working capacity model starts with the revenue target and works forward through four stages, according to RevenueTools’ capacity planning framework.
- Segment the revenue target. Break your annual number down by sales motion (SMB, mid-market, enterprise) and by quarter, since each motion has different quota sizes, cycle lengths, and ramp times.
- Convert quota into productive capacity. Multiply each rep’s quota by expected attainment (not 100%) and by the fraction of the year they’ll actually be selling at full capacity.
- Model ramp and attrition as cohort curves. Every hiring cohort ramps on its own timeline, and every cohort loses some reps to attrition before it reaches full productivity.
- Calculate required rep-years and translate into a hiring cadence. Once you know how many productive rep-years you need, back into the actual number of hires, spaced across the year to hit the target.
The output of this process is two numbers: total rep-years of capacity required, and a month-by-month hiring schedule that gets you there. Everything else in your capacity model exists to make those two numbers accurate.
What Inputs Actually Drive the Model?
Four inputs decide whether your capacity model reflects reality or wishful thinking: attainment, ramp curves, attrition, and pipeline coverage. Get these four right and the rest of the model is arithmetic.
Median attainment tells you what a typical rep actually delivers, which is the number you should multiply against quota to get attainment-adjusted productivity.
Ramp curves vary sharply by segment. SMB reps typically ramp to full productivity in 2 to 3 months, mid-market reps take 4 to 6 months, and enterprise reps often need 6 to 9 months before they’re closing at full capacity, based on patterns compiled by RevenueTools. Model partial contributions during ramp instead of treating a rep as either “producing” or “not producing.” A mid-market rep in month 3 of a 5-month ramp isn’t at zero.
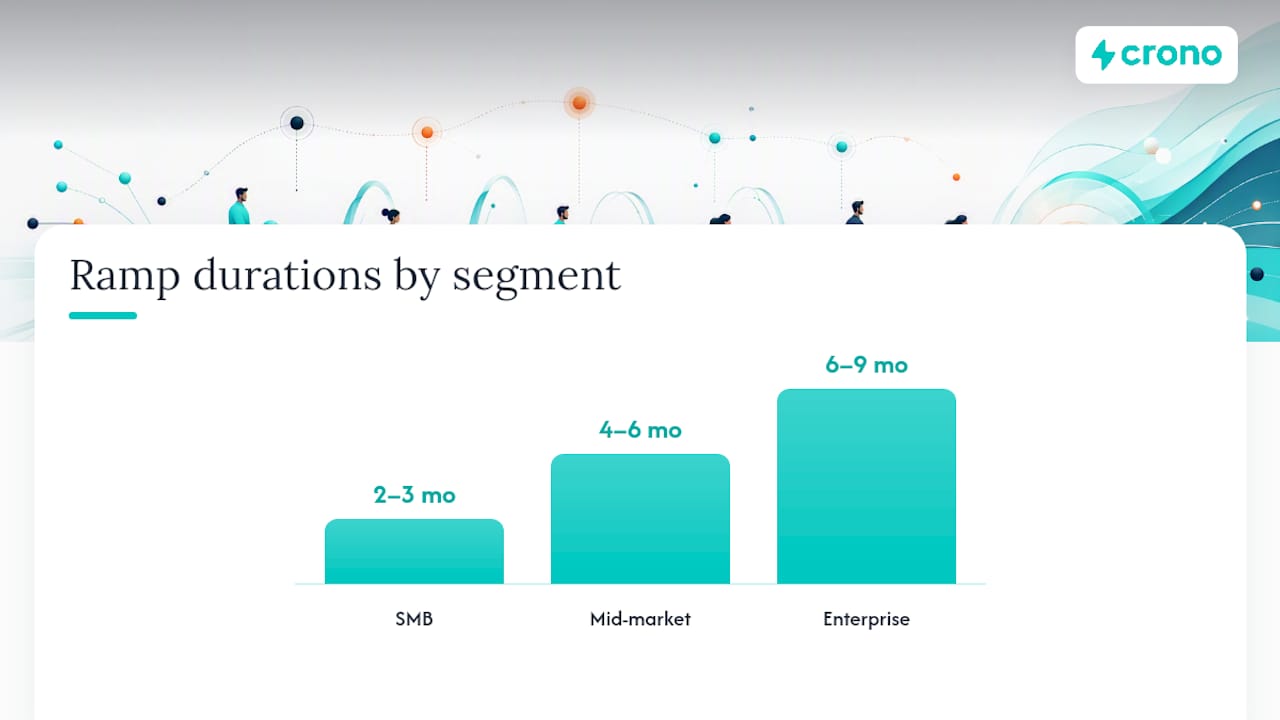
Build that lag into starting headcount rather than discovering the gap in Q3.
Pipeline coverage should track cycle length. Shorter sales cycles need lower coverage ratios, in the 2x to 3x range, while longer enterprise cycles typically need 4x to 6x coverage to hit the same close rate, according to RevenueTools. Coverage should be segmented by territory and motion, not applied as a single blanket ratio across the whole team.
Pro Tip: *Run your attainment and ramp assumptions against last year’s actual numbers before you trust this year’s model.
How Do You Turn the Model Into an Actual Hiring Calendar?
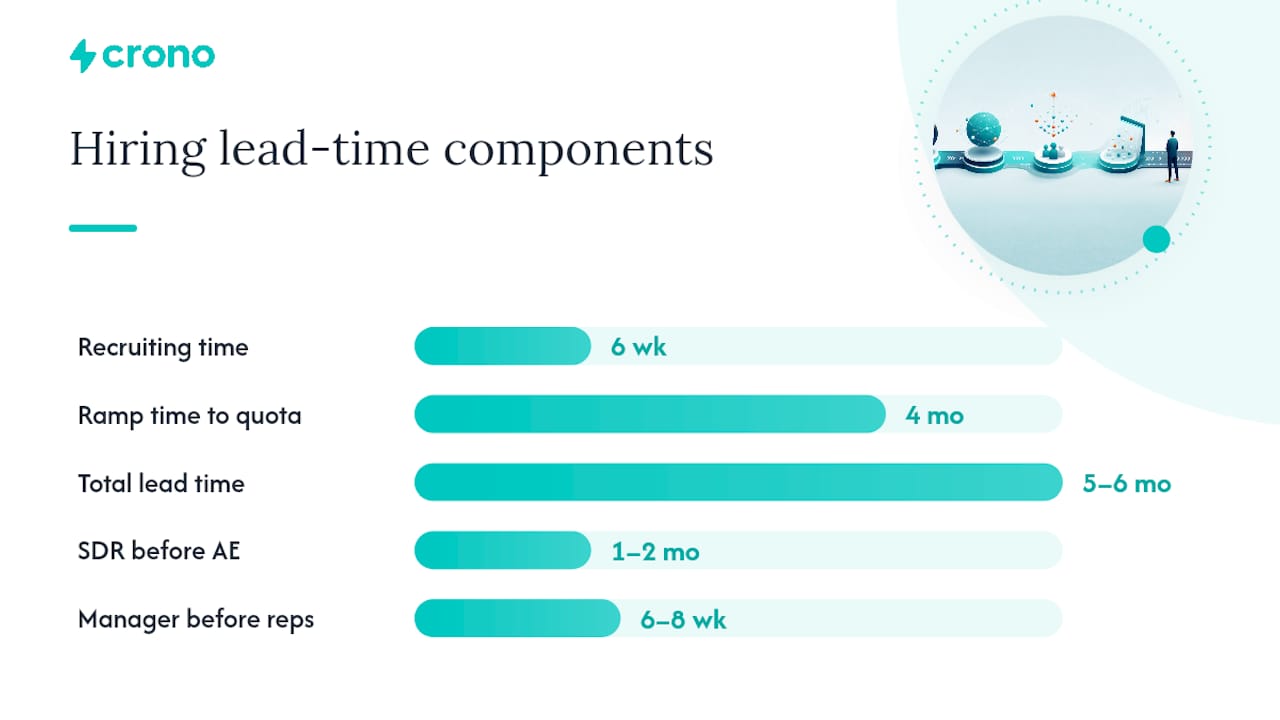
The single biggest planning error is treating “time to hire” as the only lead time that matters. Recruiting time plus ramp time equals your real lead time, and that number is almost always longer than sales leaders budget for. If it takes 6 weeks to fill an AE role and another 4 months to ramp them to full quota, you need to start recruiting roughly 5 to 6 months before you need that rep at full capacity.
Cohort-based hiring, rather than one-off requisitions, smooths onboarding load on managers and maximizes the number of productive months you get out of each hire class, a pattern confirmed in CRO Report’s headcount planning research. Four practical sequencing rules follow from that:
- Hire SDRs 1 to 2 months before the AEs they’ll feed. An AE with no pipeline handed to them on day one of ramp is an AE who ramps slower than the model assumes.
- Hire managers 6 to 8 weeks ahead of the reps they’ll manage. A manager who is still onboarding themselves while trying to coach five new AEs produces worse ramp outcomes across the entire cohort.
- Stagger cohorts rather than hiring in one large batch. Spreading hires across 6 to 8 week intervals keeps onboarding load manageable and avoids a “class of 10” all competing for the same ramp-period coaching attention.
- Adjust span of control before you scale headcount. If a manager is already at 8 direct reports, adding 4 more new hires to their roster this quarter is a recipe for a slower ramp across the board, not a capacity win.
Hiring managers ahead of their teams and staggering cohorts consistently improves time-to-first-deal, based on the same CRO Report analysis. Treat that lead time as fixed, and hire earlier than instinct tells you to.
Worked Example: Turning a Revenue Target Into a Hiring Number
Here’s the math, using round numbers you can drop straight into a spreadsheet.
Say your mid-market team carries a $10 million net new revenue target for the year. Each AE quota is $1 million.
- Attainment-adjusted quota: $1,000,000 × 0.80 = $800,000 per fully-ramped rep-year, following the formula outlined by ORM.
- Productive fraction for a new hire: a rep ramping over 5 months contributes roughly 60% of a full productive year in year one (accounting for partial-capacity months during ramp), so their effective capacity is $800,000 × 0.60 = $480,000.
- Required rep-years for tenured reps: if 6 of your reps are already fully ramped, they deliver 6 × $800,000 = $4,800,000.
- Remaining gap: $10,000,000 minus $4,800,000 leaves $5,200,000 to cover with new hires at $480,000 of effective capacity each, meaning roughly 11 new AEs, before accounting for attrition backfills.
Pipeline coverage at 4x on that $10 million target means marketing and SDR teams need to generate $40 million in qualified pipeline across the year, a number worth checking against current demand-generation capacity before you finalize the hiring plan. Build this into an editable spreadsheet or sales plan template and the calculation scales to any target.
Does Your Territory Design Actually Support the Model?
A capacity model can be mathematically correct and still fail if territories don’t have enough addressable revenue to support the reps assigned to them. One-to-one territory assignment works when account density and deal size are consistent across the market. It breaks down in markets with a handful of massive accounts and a long tail of small ones, where shared or pod-based coverage usually performs better.
Validate your model against territory reality using a simple workload index:
- Count total addressable accounts per territory and compare against your target activity volume per rep.
- Check whether territory potential (total addressable revenue) actually supports the quota assigned to that territory.
- Flag territories where potential falls short and consider merging them, adjusting quota, or shifting to a team-based coverage model instead of forcing a 1:1 rep assignment.
- Revisit territory design whenever you add headcount, since new hires often expose territory splits that were never quite right to begin with.
If territory potential genuinely can’t support the modeled capacity, the fix isn’t to hire fewer reps. It’s to redesign the territories, expand the addressable market, or lower the quota assigned to that segment.
How Do You Validate the Plan and Avoid the Most Common Mistakes?
Backtest the model before you trust it. Take last year’s actual roster, actual ramp timelines, and actual attainment, and run them through this year’s model logic. If the model had predicted a different revenue outcome than what actually happened, your attainment or ramp assumptions need adjusting, not the target itself, a discipline ORM’s headcount methodology treats as non-negotiable.
Refresh the model monthly. Update hire dates as they actually land, track each cohort’s ramp status against plan, and recalculate attainment and attrition assumptions as fresh data comes in.
The mistakes that break capacity models tend to repeat across companies:
- Using quota instead of attainment, which overstates true capacity by 15% to 30% depending on the team.
- Treating attrition as a rounding error instead of budgeting real backfill lead time for every departure.
- Underfunding pipeline relative to the hiring plan, leaving new reps fully ramped with nothing to sell.
- Ignoring the support-role ratio, since AEs without enough SDR or enablement support ramp slower and churn faster.
Pro Tip: Model every backfill as a brand new hire with its own ramp curve, not as a same-day replacement. Then report your capacity in productive rep-months instead of headcount. A team of 20 reps where 4 are mid-ramp is not a 20-rep team. It’s closer to 17.
What Tools and Templates Make This Easier to Run?
You don’t need enterprise financial-planning software to run a credible capacity model. A well-built spreadsheet with a cohort hiring calendar, a ramp curve library by segment, and a pipeline coverage calculator covers most of what a mid-sized revenue team needs, and analyst coverage of dedicated planning platforms like Pigment confirms that the underlying modeling logic, not the tool itself, is what determines accuracy.
A few resources worth building into your workflow:
- An editable capacity spreadsheet with formulas for attainment-adjusted productivity and cohort ramp math.
- A SDR-specific capacity playbook for sequencing pipeline-generation hires ahead of AE cohorts.
- A predictable-revenue strategy guide for connecting hiring plans to broader pipeline and forecasting processes.
Once the model exists, the harder problem is usually execution: keeping cadences running, data clean, and reps focused on the accounts most likely to close.
What Do Practitioners Get Wrong Most Often About This?
The failure mode I see most isn’t a bad spreadsheet. It’s a good spreadsheet nobody revisits. Teams build a careful capacity model in January, then hire off gut feeling by June because the model “felt done.”
The second pattern is RevOps consistently under-resourcing the wrong side of the ledger. Leaders fund AE headcount aggressively but treat SDR capacity, manager bandwidth, and pipeline generation as afterthoughts. A fully staffed AE team with underfunded pipeline behind it is just expensive idle capacity waiting for meetings that never get booked.
The fix isn’t more hiring. It’s sequencing: managers before teams, SDRs before AEs, pipeline funded before quota is assigned. Get that order right and the model actually holds up past Q1.
Put the Capacity Model to Work With Crono
A spreadsheet tells you how many reps to hire and when. It doesn’t fill your new reps’ pipeline, keep outreach cadences running while a cohort ramps, or flag which accounts are actually showing buying signals right now. That’s the execution gap between a capacity plan and a capacity plan that actually pays off.
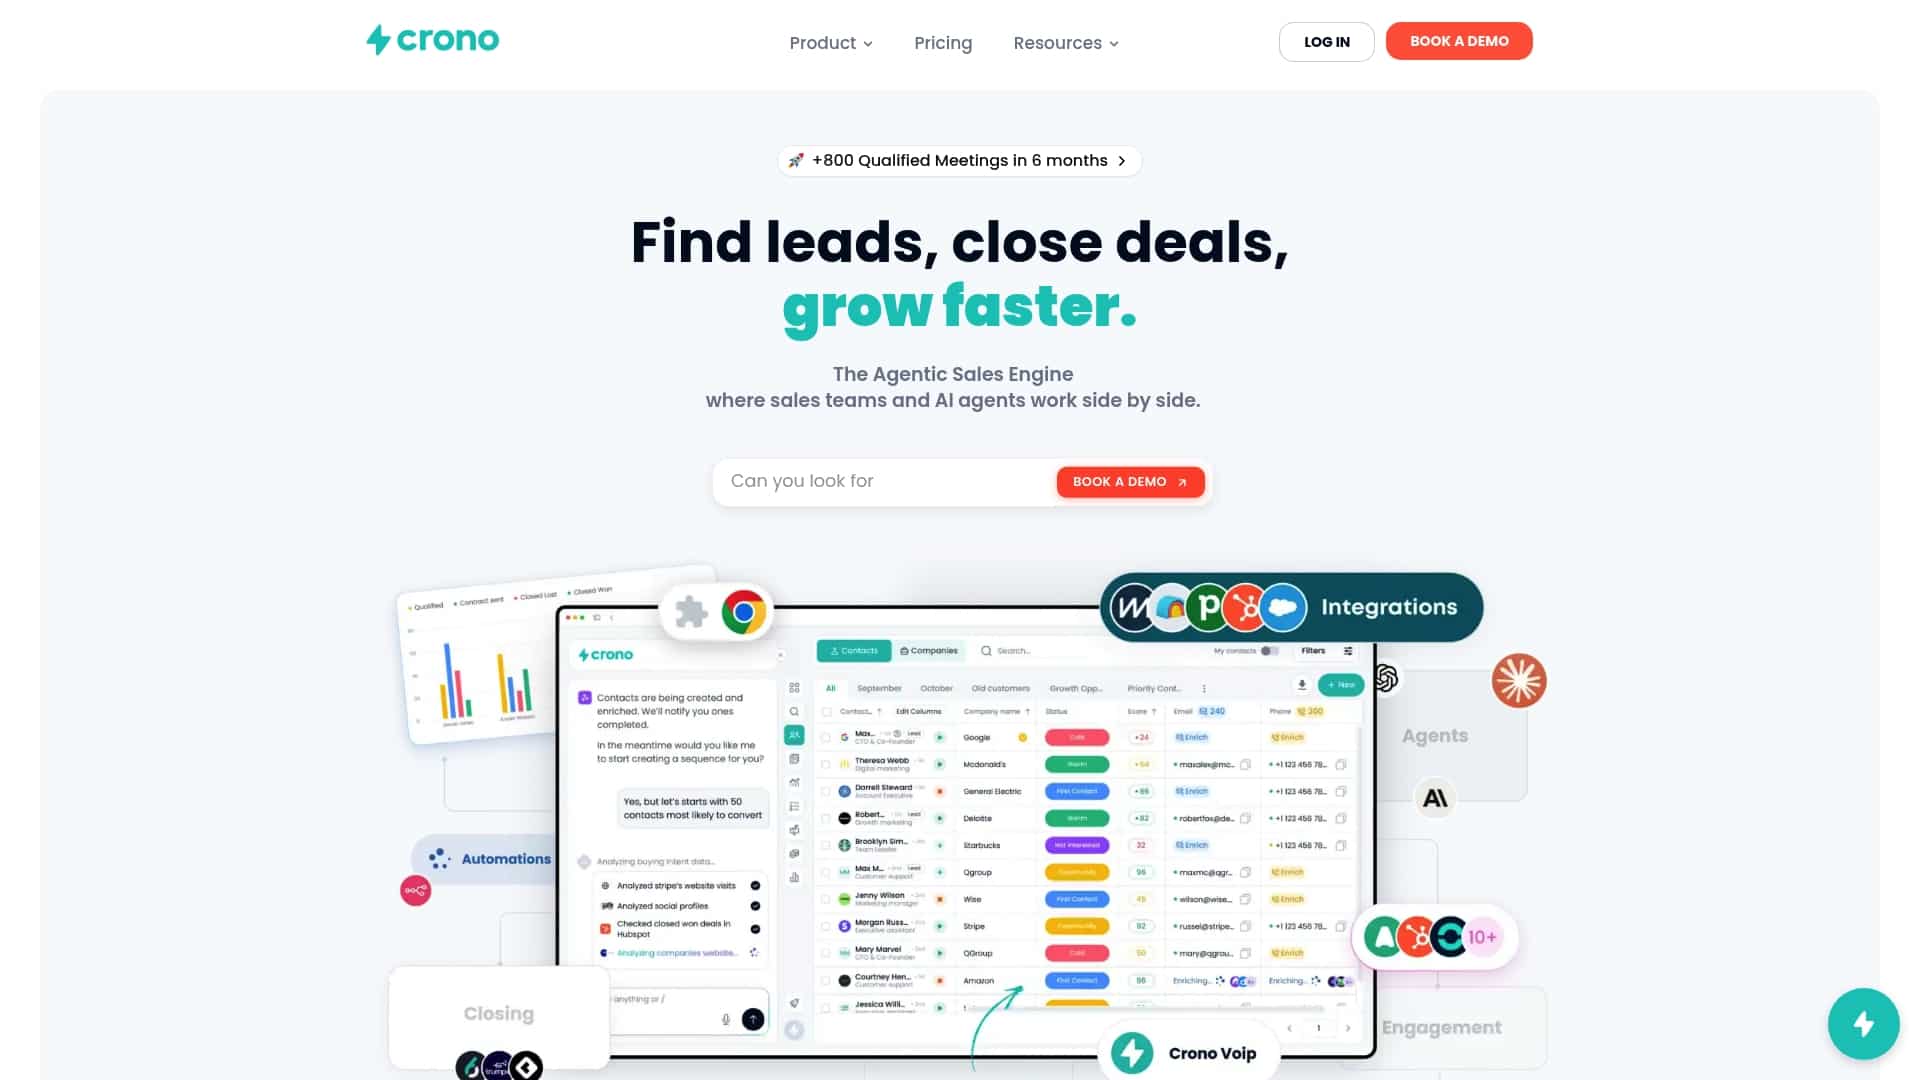
Some sales execution platforms connect your CRM and prospecting tools into one execution layer, so new hires can work enriched account data and automated multichannel cadences instead of building lists from scratch during their ramp window. This can directly improve ramp curves in capacity models, since faster time-to-first-meeting helps the productive-month assumptions hold up in practice instead of just on paper. Execution layer orchestration tools can help surface which accounts and signals deserve rep attention first, which matters when pipeline coverage is tight and every rep-hour needs to count.
If you’re building out a hiring calendar this quarter, take a look at the Crono platform and see how a connected execution layer fits into the capacity plan you just built.
Sources
- Sales Capacity Planning (Salesforce blog)
- Sales capacity planning guide (RevenueTools)
- Sales hiring plan: Headcount planning for revenue leaders (CRO Report)
- How to calculate sales headcount for a revenue target (ORM)
