
Sales forecast accuracy measures how close your predicted revenue lands to what actually closes, expressed as a percentage variance for a defined period. Elite teams hold that variance to ±5–10%.
Good teams run ±10–15%, and most B2B organizations sit in the ±15–25% range. None of those bands mean anything unless you first lock down the period, the revenue basis, and the exact date the forecast was submitted.
How Do You Calculate Sales Forecast Accuracy?
The single-period formula is simple: 1 minus the absolute value of (actual minus forecast) divided by actual, times 100. That looks clean until you try to average it across ten reps or four quarters, and the math starts working against you.
That’s where MAPE (Mean Absolute Percentage Error) and WMAPE (Weighted MAPE) diverge. WMAPE weights errors by actual revenue, which is why Gartner recommends it for revenue comparisons. A $5,000 miss barely moves WMAPE. A $500,000 miss moves it a lot, and that’s exactly how your CFO thinks about risk.
You also need a bias measure. MPE (Mean Percentage Error) keeps the sign instead of taking the absolute value, revealing whether you’re systematically sandbagging or systematically overshooting. Before you compare any two forecasts, document three things:
- The period the forecast covers (monthly, quarterly, trailing)
- The revenue basis (bookings, recognized revenue, or ARR)
- The submission point (forecast locked at start of quarter versus mid-quarter update)
Skip that documentation and every benchmark conversation turns into an argument about apples and oranges.
What Counts as a Good Forecast Accuracy Benchmark?
Practitioner data puts most B2B teams squarely in the ±15–25% variance band, with top-quartile performers reaching ±5–10% through structured process and clean data, according to mxmrevenue’s benchmark research.
Where you land on that spectrum depends heavily on stage and revenue basis:
- Early-stage (Series A, sub $10M ARR): ±20–30% is common and often tolerated, since deal volume is low and any single deal swings the total.
- Growth stage (Series B/C, $10M–$100M ARR): ±15–20% is the realistic target as pipeline volume smooths out single-deal noise.
- Mature/public-adjacent companies: ±5–15% becomes the expectation, since investors and boards demand tighter variance history.
A forecast measured against bookings will read very differently than one measured against recognized revenue, particularly for companies with usage-based or multi-year contracts. Benchmarking against an industry average without matching your own revenue basis and stage produces a target that’s either impossible or meaningless.
Why Does Sales Forecast Accuracy Actually Matter?
Forecast variance drives decisions with long lead times, and hiring is the clearest example. Sales headcount plans typically run four to six months ahead of quota-carrying capacity, so a forecast that’s off by 25% either leaves you short-staffed heading into a growth quarter or stuck paying ramp costs for reps you didn’t need.
Budget and cash-flow planning absorb the same risk. Systematic over-forecasting inflates spending commitments against revenue that never materializes; systematic under-forecasting causes companies to sit on cash reserves that should have funded expansion. Neither error is neutral, and both compound quarter over quarter if nobody tracks the bias.
Boards and investors read forecast variance as a proxy for operational discipline.
What Causes Inaccurate Sales Forecasts?
Most accuracy problems trace back to three overlapping sources, and you can diagnose all three in about an hour with your current CRM export.
- CRM data decay. Missing or stale close dates, “ghost deals” that have had zero activity in 60+ days but still carry full forecast value, and deal amounts nobody has revisited since the demo call.
- Process gaps. Deals skip stages without meeting exit criteria, nobody reconciles forecast to actual close on a fixed cadence, and stage definitions mean different things to different reps.
- Behavioral bias. Reps round up because optimism feels safer than a hard conversation with their manager, and some pad precision (forecasting $47,250 instead of “around $45K to $50K”) to look more rigorous than the data supports.
Compensation plans often make the bias worse, not better, when quota attainment is scored purely against the forecast number rather than against forecast accuracy. Panel research on incentivized quarterly forecasts found that only a relatively small share landed within a tight 10% range of actual next-quarter sales, with a consistent bias toward optimism, though short dashboard exposure and incentive tweaks reduced that noise modestly.
Pro Tip: *Pull every open deal with a close date in the past 30 days and zero logged activity in the last two weeks.
The 30 to 90 Day Playbook to Improve Forecast Accuracy
Fixing forecast accuracy is a governance project first, not an analytics project. Sequence the work in this order, because skipping ahead to modeling before pipeline hygiene is fixed just automates bad data faster.
- Install stage exit criteria with required artifacts. A deal doesn’t move to “Commit” without a signed mutual action plan or a confirmed champion email, for example. No artifact, no stage advance.
- Run a weekly variance review. Compare last week’s forecast to this week’s, flag any deal that moved amount or close date without a logged reason, and assign an owner for each flag.
- Reconcile CRM to cash every quarter. Pull closed-won deals against actual invoiced or recognized revenue and reconcile the gap. Discrepancies here almost always point back to stage definition problems.
- Assign data stewardship with enforcement. Someone owns required-field completion, and incomplete records get kicked back before forecast submission, not after.
Most teams that follow this sequence see measurable variance reduction inside one to two quarters, largely because ghost deals and stale amounts get purged before they ever hit the forecast roll-up. Pipeline hygiene work built into a weekly audit routine tends to compound: each week of clean data makes the next week’s variance review faster.
Pro Tip: Don’t run the weekly variance review as a status meeting. Run it as an exception report. If nothing changed on a deal, don’t discuss it. Spend the time entirely on deals that moved and demand a reason for every move.
When Should You Add Predictive Models to Your Forecast?
Models earn their place only after governance and hygiene are fixed, because a predictive layer trained on stale close dates and ghost deals just automates the same bias at scale. Once your data is clean, several AI use cases apply:
- Time-series models work well for stable, high-volume pipelines with predictable seasonality.
- Regression models incorporate deal-level features like activity count, deal age, and stage velocity.
- ML ensembles blend multiple approaches and generally outperform any single method, particularly across varied time horizons and deal sizes, according to research on quantitative forecasting architectures.
No single method wins consistently, which is why coordinating several non-redundant approaches tends to beat betting on one model. Predictive sales analytics that combines deal velocity, engagement signals, and historical win rates can sharpen prioritization and shrink short-term variance, but only on top of clean inputs. Evaluate model output with WMAPE for revenue-weighted accuracy, MAE for average deal-level error, and RMSE when large misses deserve extra penalty. A model is a multiplier on your data quality, not a substitute for it.
What Operating Rhythm Keeps Forecast Accuracy on Track?
Accuracy work doesn’t hold without a fixed cadence. Weekly, run pipeline roll-ups and a variance call that flags every deal movement. Monthly, review stage conversion rates and deal aging by segment. Quarterly, run the full CRM-to-cash reconciliation and reset targets if the revenue basis or team structure changed.
Track a short dashboard rather than a sprawling one:
- Rolling WMAPE over the last four periods
- MPE to catch systematic optimism or pessimism
- Percentage of deals with complete required fields
- Average deal age by stage, flagged against your historical median
Practitioner benchmarks show that structured process alone can move a team from the ±15–25% typical band toward the ±5–10% elite range over time, per mxmrevenue’s analysis. When presenting to executives, skip the methodology explanation. Show the rolling WMAPE trend line and the bias direction. That’s the whole conversation.
What Are the Most Common Forecasting Pitfalls?
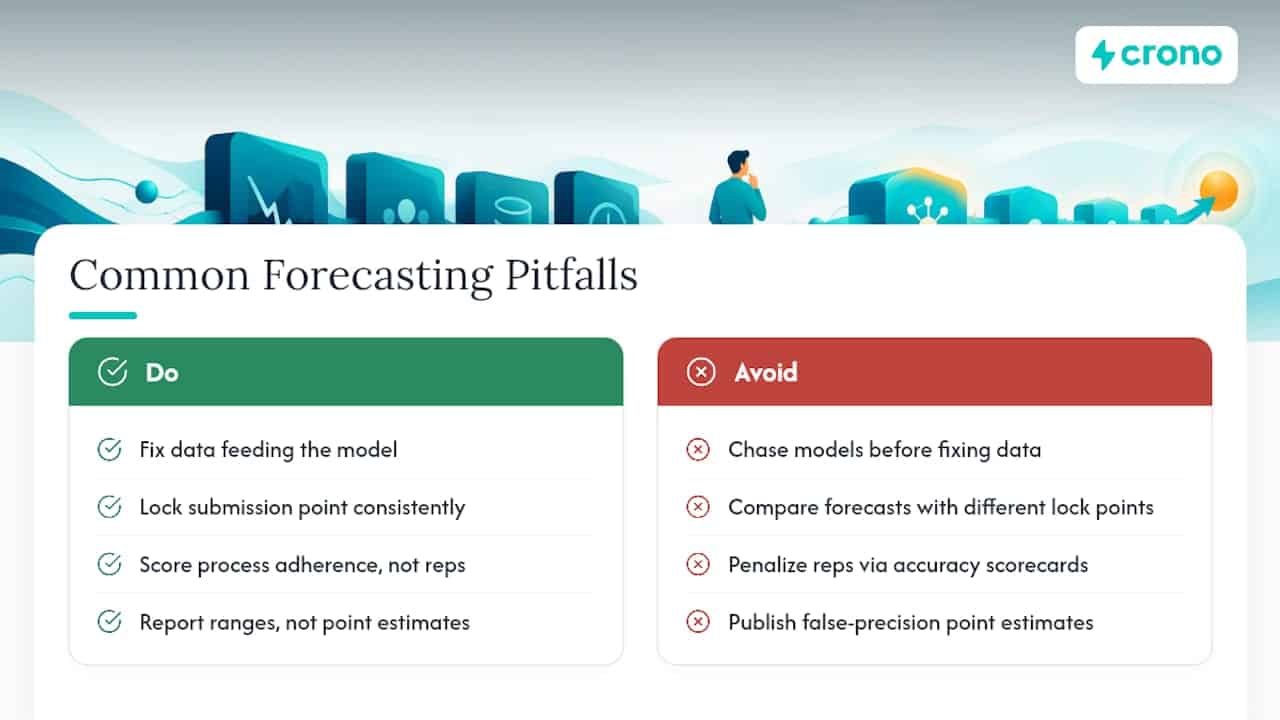
The single most common mistake is chasing a better model before fixing the data feeding it. A regression or ensemble trained on ghost deals and stale close dates just produces a more confident version of the same wrong number, and teams often don’t discover this until the model’s variance turns out worse than the simple rep-submitted forecast it replaced.
The second pitfall is measuring accuracy inconsistently across periods. If Q1’s forecast was locked two weeks before quarter close and Q2’s was locked on day one, comparing their variance tells you nothing. Fix the submission point before you fix anything else, or every trend line you build afterward is comparing different things and calling them the same metric.
A third trap: treating forecast accuracy as a rep-level scorecard metric instead of a process metric. When individual reps get penalized for missing their own forecast, they respond rationally by sandbagging or padding, whichever protects them better. That behavior degrades the aggregate number faster than any data quality issue. Accuracy improves when the review focuses on process adherence (did the deal meet exit criteria, was the reason for movement logged) rather than on whether any single rep hit their number.
A fourth, quieter pitfall is over-engineering precision. A forecast stated as “$847,250” sounds rigorous but is usually false confidence dressed up as data. Ranges communicate uncertainty honestly and tend to survive scrutiny better once actual results come in. Teams that resist rounding pressure from stakeholders generally end up with more durable trust in their numbers, because a range that holds up looks better in hindsight than a false-precision point estimate that missed.
How Have Real Teams Improved Forecast Accuracy?
The pattern across successful accuracy turnarounds is consistent: process changes precede any analytics investment, and the biggest early gains come from pipeline hygiene rather than modeling sophistication.
Panel research on incentivized forecasting found that short-term dashboard exposure, essentially giving forecasters a clearer view of recent trend data, produced measurable reductions in forecast noise and modest gains in prediction accuracy, even without any change to the underlying sales process. The same research found those gains didn’t automatically persist once the dashboard access ended, which points to a practical lesson: accuracy tools work best when embedded into a recurring habit, not offered as a one-time intervention.
That’s consistent with what the operational playbook above assumes. A quarter of disciplined stage-exit enforcement and weekly variance review tends to surface and remove the ghost deals and stale amounts that were inflating variance in the first place, often before any predictive model gets involved. Teams that add ensemble forecasting models on top of that cleaned foundation see the models actually earn their keep, catching pipeline-level patterns that a manual roll-up misses, rather than just amplifying noise that was already there.
The common thread isn’t a specific tool or a specific model architecture. It’s sequencing: governance, then hygiene, then analytics, in that order, with a fixed cadence enforcing each step.
What Tools Help Teams Improve Forecast Accuracy?
CRM platforms remain the system of record, but forecast accuracy problems are rarely solved inside the CRM alone, since CRMs record what reps enter without judging whether the data reflects reality. That gap is exactly where dedicated tooling adds value.
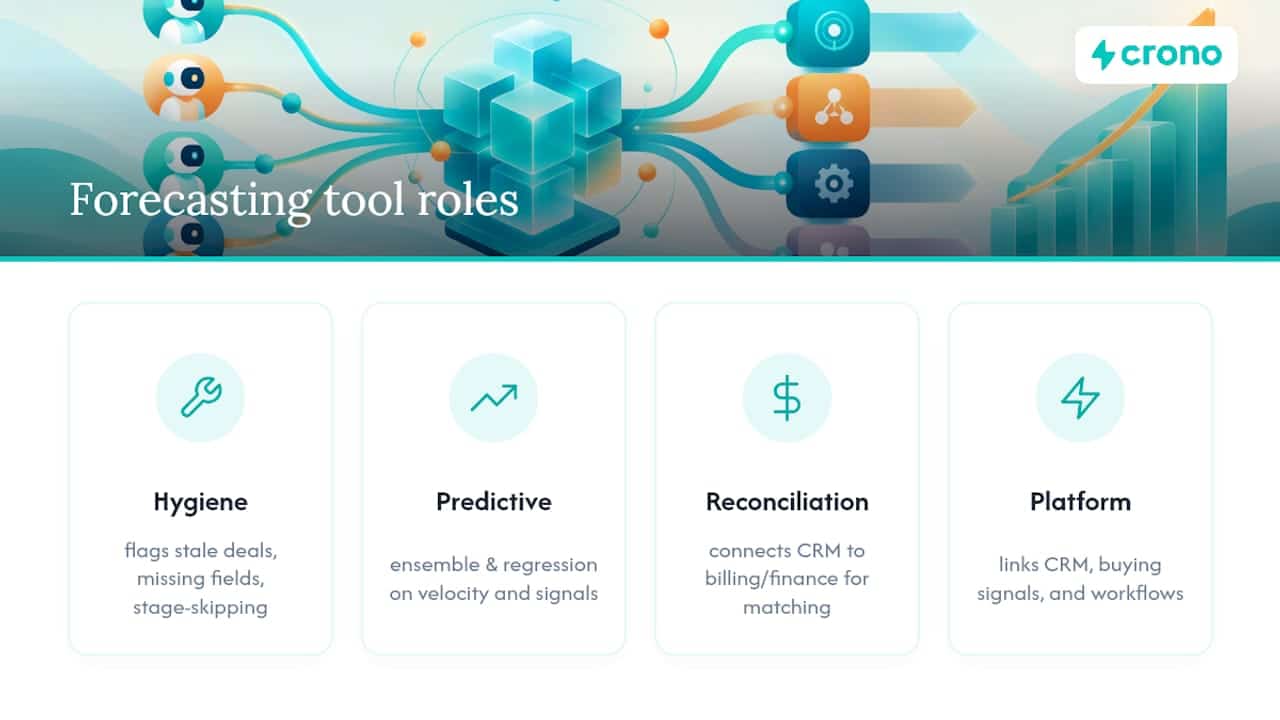
Pipeline hygiene tools that flag stale deals, missing required fields, and stage-skipping automatically save the manual audit work that most RevOps teams currently do by hand in a spreadsheet. Predictive analytics layers apply the ensemble and regression approaches covered earlier, feeding on deal velocity and engagement signals to sharpen probability estimates. Reconciliation tools connect CRM data to billing or finance systems so the CRM-to-cash step in the quarterly playbook doesn’t require a manual export-and-match exercise each time.
A sales execution platform like Crono sits across this stack rather than replacing any single piece, connecting CRM data, buying signals, and workflow automation so hygiene enforcement and pipeline visibility happen inside the same system reps already use daily. That matters because tools that live outside the rep’s daily workflow tend to get ignored, and ignored tools don’t fix forecast accuracy no matter how sophisticated their underlying model is.
Whatever stack you choose, the tool selection matters less than whether it enforces the governance rules covered earlier: required fields, stage exit criteria, and a documented reconciliation process. A tool that automates bad process just produces bad forecasts faster.
How Should Forecasting Align With Strategy and Compensation?
Forecast accuracy work fails when it lives in a silo separate from how the business actually plans and pays people. If finance builds its budget off one revenue basis while sales forecasts against another, no amount of process discipline closes that gap, because the two numbers were never measuring the same thing.
Start by aligning the revenue basis across finance, sales, and the board. If the company reports recognized revenue externally, the sales forecast should be reconcilable to that basis, even if reps track against bookings day to day. Document the translation between the two so nobody discovers the mismatch during a board meeting.
Compensation plans deserve equal scrutiny. If reps are paid on hitting their individual forecast number rather than on pipeline health or process adherence, you’ve built an incentive to sandbag or inflate depending on which behavior protects the rep better that quarter. A quota coverage model that segments targets by realistic capacity, rather than applying a blanket multiplier across every rep, tends to produce forecasts that better reflect what the pipeline can actually deliver.
Strategy alignment also means matching forecast cadence to how the business actually makes decisions. If the board reviews numbers quarterly but hiring decisions get made monthly, your forecasting cadence needs to serve the faster cycle, not just the slower one. Build the operating rhythm around the decisions the forecast is meant to inform, not around a calendar convention inherited from a previous fiscal year.
What Sales Leaders Get Wrong About Fixing Forecast Accuracy
Most leaders expect accuracy gains to come from a better model. In practice, the fastest and most durable gains come from unglamorous governance work: stage exit criteria, weekly variance reviews, and a compensation plan that doesn’t reward optimism. Teams that fix process first typically see measurable variance reduction within one or two quarters, well before any predictive layer gets involved. The mistake isn’t lacking sophistication. It’s skipping the boring step that makes sophistication worth adding.
Turn This Playbook Into a Working Forecast System
Everything in this playbook, stage exit criteria, weekly variance reviews, CRM-to-cash reconciliation, depends on pipeline data that’s actually current, and that’s the part most teams struggle to sustain manually. Crono connects your CRM, buying signals, and outreach data into one execution layer, so the hygiene checks and stage enforcement described above run inside the same workflow your reps already use instead of a separate audit process nobody keeps up with.
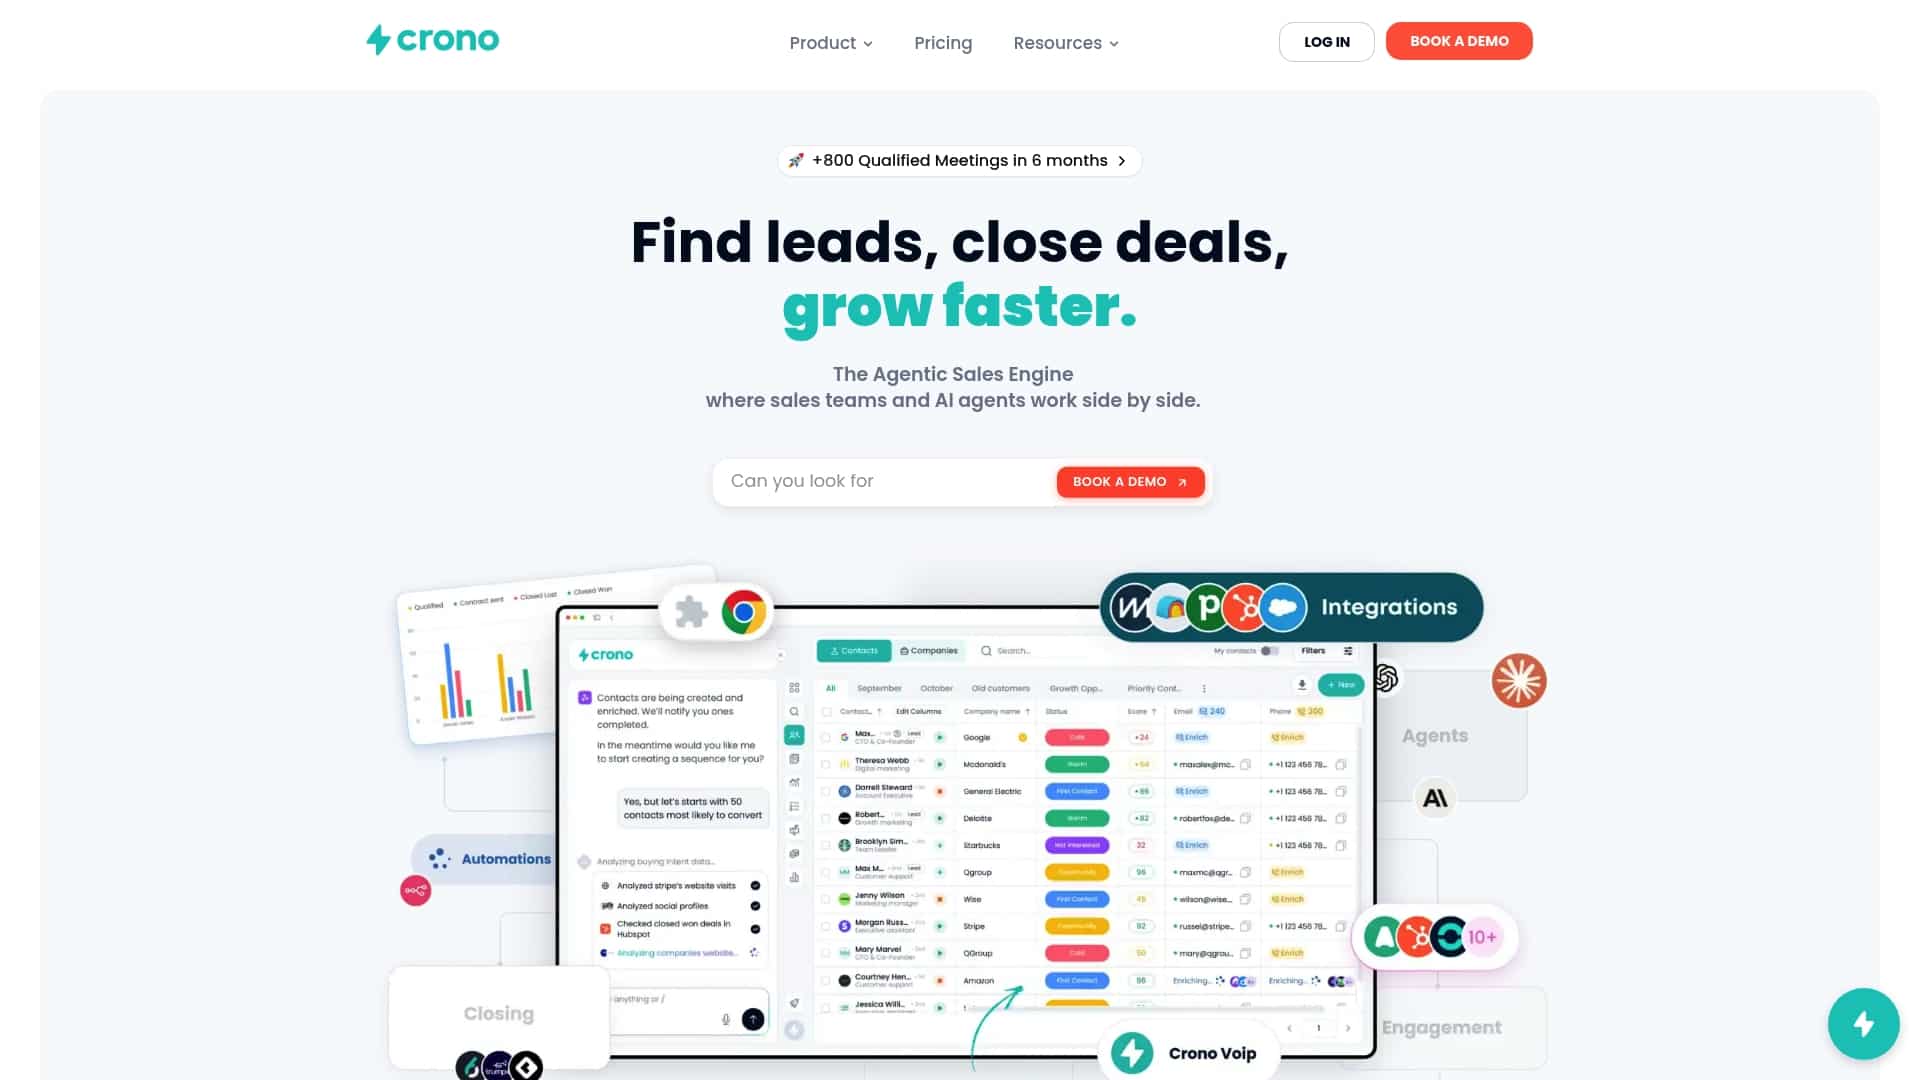
For teams ready to test this against their own pipeline, Crono’s Agentic Sales Engine applies automated enrichment and workflow rules that catch stale deals and missing fields before they distort your forecast. Plans start at $79 per seat per month with the Pro tier, with an Ultra tier and Enterprise options available for larger revenue teams. If you want to see how it applies specifically to your forecast cycle, book a walkthrough and run it against your next quarter’s pipeline.
Sources
- Rationalizing firm forecasts (LSE/working paper, panel experiment)
- Quantitative Forecasting in Sales Analytics: Methodologies, Accuracy Frameworks, and Predictive Performance (IJISAE)
- Gartner — forecast accuracy (glossary)
- Sales forecast accuracy (mxmrevenue insights)
FAQ
How Do You Calculate the Accuracy of a Sales Forecast?
Subtract your forecast from actual results, take the absolute value, divide by actual, then subtract that from 1 and multiply by 100. For comparing revenue across reps or periods, WMAPE is the more defensible metric because it weights errors by actual deal size rather than treating every deal equally.
What Is a Good Sales Forecast Accuracy Level?
Good teams typically land within ±10–15% variance, while elite teams with structured process and clean data reach ±5–10%, according to practitioner benchmark data.
What Is Considered a Good Forecast Accuracy Level for Early-Stage Companies?
As pipeline volume grows and smooths out that noise, the realistic target tightens toward the ±15–20% range typical of growth-stage teams.
What Is the Golden Rule of Forecasting?
The closest thing to a golden rule is measurement consistency: never compare forecast accuracy across periods unless the revenue basis, submission point, and time period are identical. Skipping this step is the single most common reason teams misread their own progress.
Does Crono Help Improve Sales Forecast Accuracy?
Crono connects CRM data, buying signals, and workflow automation into one execution layer, which helps enforce the pipeline hygiene and stage discipline that drive forecast accuracy gains. Pricing starts at $79 per seat per month, with Agentic Sales Engine credit packs available separately for enrichment and automation tasks.
