
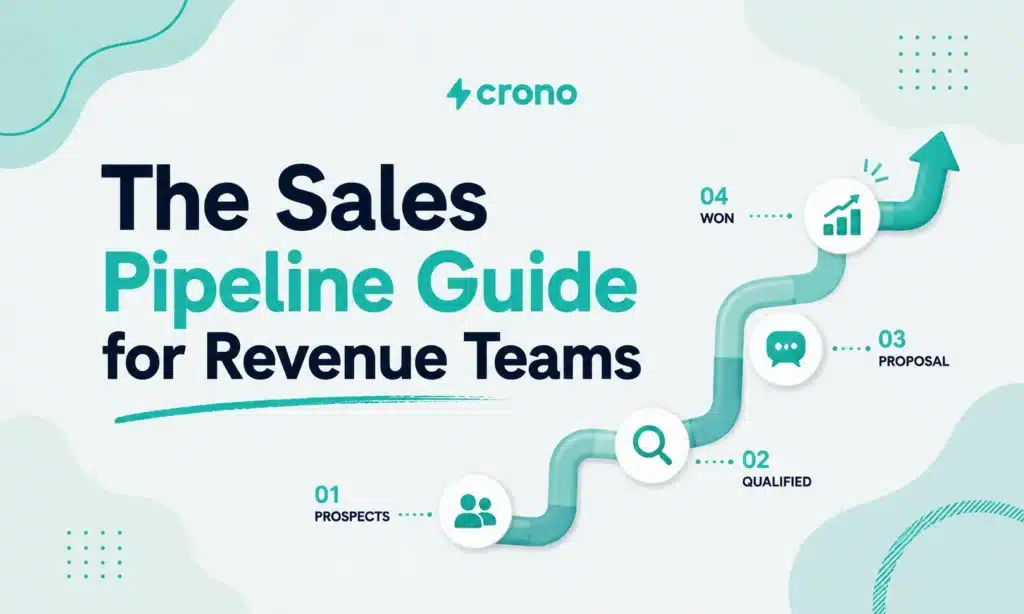
A sales pipeline is a staged, measurable system that tracks every active deal from first contact to closed revenue, giving managers the visibility they need to forecast accurately and coach reps on what to do next. According to TechTarget, it functions as a visual representation of where prospects are in the sales process, used to forecast likely closes and monitor quota progress.
Before you read further, do this one thing in the next 30 minutes:
- Pull your current open deals from your CRM, group them by stage, and note how many have had no activity in the last 14 days. That single view will tell you more about your pipeline health than any dashboard report.
The rest of this guide gives you stage templates with entry and exit criteria, the KPIs that actually matter, and a worked weighted-forecast example you can run on your own data today.
Key Takeaways
A well-governed sales pipeline converts deal-tracking discipline into predictable revenue by combining clear stage criteria, weighted forecasting, and a weekly review cadence.
| Point | Details |
|---|---|
| Stage criteria drive forecast accuracy | Each stage needs an observable buyer action as its exit criterion, not a rep task. |
| Weighted forecasting requires historical data | Calculate stage probabilities from 2–4 quarters of closed deals; lock them in your CRM so reps cannot override them. |
| Coverage targets depend on win rate | Required pipeline coverage ≈ 1 ÷ win rate; SMB teams typically need 3x, enterprise teams 4x. |
| Weekly reviews catch problems early | Teams that review weighted pipeline against quota weekly fix problems before they become quarter-end surprises. |
| Crono automates pipeline execution | Crono connects CRM data, AI agents, and multichannel outreach to keep deals moving and forecasts clean without manual hygiene. |
Table of Contents
- What is a sales pipeline and why does it matter?
- Common pipeline stages and what each one actually requires
- What you need before you build a pipeline
- How to design stages that match your buyer’s journey
- Which KPIs actually measure pipeline health?
- How weighted-pipeline forecasting works
- How to implement the pipeline in your CRM, step by step
- How to diagnose and fix pipeline bottlenecks
- Tools, templates, and resources to operationalize your pipeline
- How Crono operationalizes the pipeline into predictable revenue
- The case for starting smaller than you think
- Crono turns your pipeline playbook into daily execution
- Primary sources and further reading
- Sources
What is a sales pipeline and why does it matter?
A sales pipeline is not the same thing as a sales funnel, and confusing the two leads to bad decisions. The pipeline tracks what your reps are doing and where each deal stands. The funnel, by contrast, shows volume attrition through the buyer journey, measuring how many leads drop off at each stage. Adobe’s guide frames it clearly: the pipeline is a salesperson-action view, while the funnel is a buyer-volume view. A flywheel is a third model entirely, focused on momentum and retention rather than linear progression.
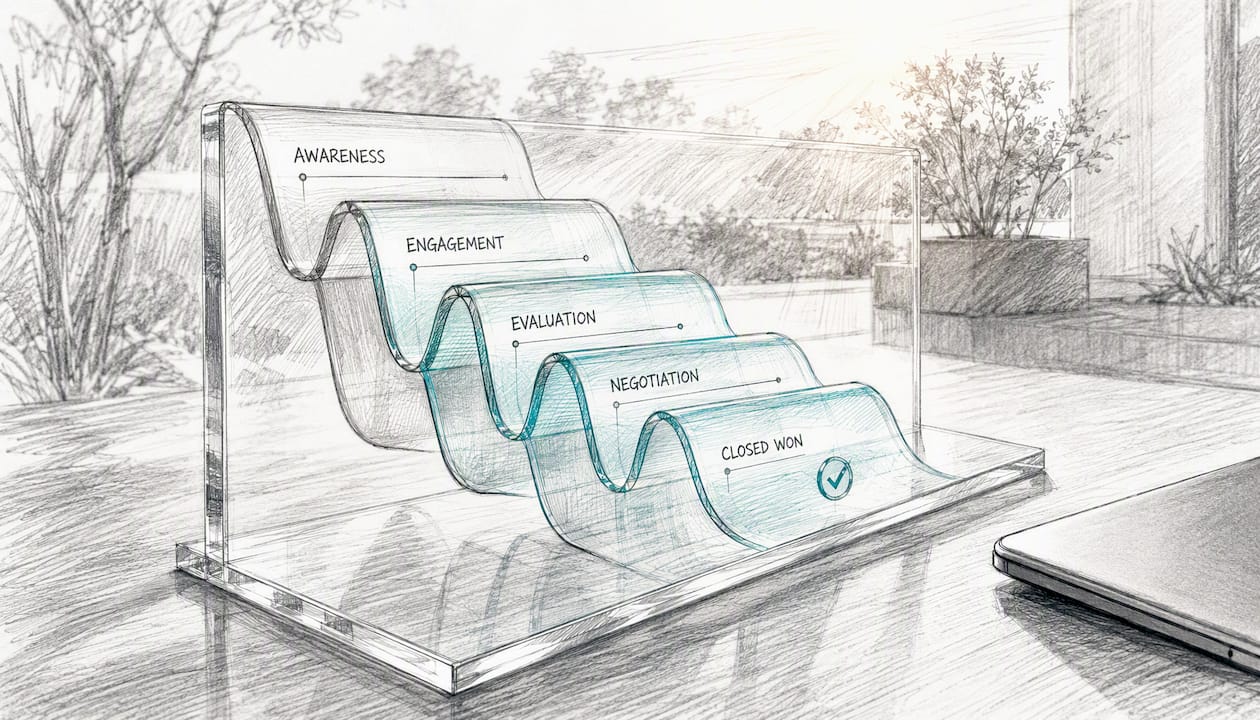
Use the pipeline for deal management, forecasting, and rep coaching. Use the funnel to measure marketing efficiency and top-of-funnel conversion. Use the flywheel when you are modeling customer-led growth and expansion revenue.
Why the pipeline model pays off in practice:
- Forecast accuracy. Weighted-pipeline math converts your open deals into a realistic expected revenue number, so you stop guessing at quarter-end.
- Resource allocation. Stage data shows where deals cluster and stall, so you can direct coaching and support where it moves the number.
- Sales hygiene. Explicit stage criteria force reps to update records consistently, which keeps your CRM data trustworthy.
- Post-sale handoffs. A well-defined close stage creates a clean trigger for customer success onboarding, reducing churn caused by poor transitions.
The tools that make this work, including CRM platforms, weighted forecasting models, and sales velocity calculations, all depend on one thing: stage definitions that are grounded in observable buyer actions rather than rep optimism.
Common pipeline stages and what each one actually requires
IBM’s THINK blog makes the point precisely: each stage should represent a specific buyer milestone so that definitions reduce missed opportunities and clarify the next action for sellers. Generic stage names like “In Progress” or “Active” fail this test. The table below gives you a starting framework you can paste directly into your CRM.
LinkedIn Sales Solutions confirms this general sequence is widely used across B2B teams, though stage names vary by industry and deal complexity.
Entry and exit criteria your reps should know cold:
- A deal does not advance to Qualification without a live conversation. Email replies alone do not qualify.
- A deal does not advance to Proposal without documented pain and a confirmed budget range.
- A deal does not advance to Negotiation without a named decision-maker engaged in the process.
- Any deal with no activity for 21 days in Proposal or later triggers a manager review flag.
Pro Tip: Run a 15-minute calibration session with your team once per quarter. Show three real deals and ask each rep independently to assign a stage. Where answers diverge, your stage definitions need sharper exit criteria.
What you need before you build a pipeline
Building a pipeline without the right inputs produces a structure that looks clean and measures nothing useful. Coursera’s sales pipeline guide recommends determining your typical sales cycle length from historical closes before you design stages, because cycle length directly shapes how you set expected close dates and probability weights.
Minimum data you need before you start:
- 2–4 quarters of closed-won and closed-lost deals, with stage history, deal value, and close date for each
- Your current ICP definition and buyer personas, segmented by company size, industry, and buying role
- Product and pricing tiers, including any distinctions between new business, expansion, and renewal motions
- A CRM export of open deals with their current stage, owner, and last-activity date
- Quota and revenue targets broken down by rep, team, and time period
Stakeholders to involve before you finalize anything:
- Sales manager or VP of Sales, who owns the forecast and the governance model
- RevOps or Sales Operations, who configures the CRM and locks probability settings
- Two or three top-performing reps, whose deal patterns should anchor your stage definitions
- One marketing contact, to align on lead handoff criteria and MQL-to-SQL definitions
- A customer success lead, to define what a clean closed-won handoff looks like and what information CS needs on day one
Skipping RevOps at this stage is the most common mistake. If stage probabilities are not locked in the CRM, reps will adjust them manually to make their forecast look better, and your weighted pipeline number becomes fiction.
How to design stages that match your buyer’s journey
The mapping exercise is straightforward: list every observable buyer action from first awareness to signed contract, and then group those actions into stages. Each stage boundary should mark a moment when the buyer’s commitment level changes, not when your rep completes an internal task.
A short mapping example:
- Buyer action: Responds to cold outreach and agrees to a call → CRM event: Meeting booked → Stage: Qualification
- Buyer action: Shares internal pain data and names a budget owner → CRM event: Discovery notes logged → Stage: Discovery
- Buyer action: Requests a formal proposal → CRM event: Proposal sent → Stage: Proposal
- Buyer action: Legal team requests contract → CRM event: Contract sent → Stage: Negotiation
This buyer-action framing, recommended by IBM, keeps your pipeline honest. A rep cannot move a deal forward by doing more work on their end; the buyer has to do something.
Segmentation decisions to make before you go live:
- New business, expansion, and renewal deals should carry separate probability tracks because their conversion rates differ significantly. A renewal at the Proposal stage closes at a much higher rate than a net-new deal at the same stage.
- If you sell two or more products with meaningfully different sales cycles, consider separate pipelines rather than forcing both into one stage sequence.
- Enterprise deals often need an additional “Executive Alignment” stage between Proposal and Negotiation; SMB deals usually do not.
On stage count: fewer stages with sharper criteria consistently outperform long multi-step pipelines. Seven stages is a reasonable ceiling for most B2B teams. Beyond that, reps start skipping stages or updating them inconsistently, and your data degrades.
Which KPIs actually measure pipeline health?
Tracking the right metrics lets you spot a problem in week three of the quarter instead of week twelve. Coursera’s pipeline management guide lists conversion metrics, win rate, and stage-to-stage progression as the core diagnostic tools, with the recommendation to intervene when deals stall rather than waiting for them to fall out.
| Metric | Formula / definition | Why it matters | Action threshold |
|---|---|---|---|
| Pipeline coverage | Total pipeline value ÷ quota | Shows whether you have enough deals to hit target | Below recommended coverage thresholds for SMB or enterprise suggest insufficient deals to hit target |
| Win rate | Closed-won deals ÷ total closed deals | Baseline for coverage targets and probability calibration | Review if it drops more than 5 points quarter-over-quarter |
| Stage conversion rate | Deals advancing from stage N ÷ deals entering stage N | Pinpoints where deals die | Any stage below 50% conversion warrants a process review |
| Average deal size | Total closed-won revenue ÷ number of closed-won deals | Tracks mix shift and pricing discipline | Flag if it drops without a deliberate pricing change |
| Sales cycle length | Average days from Qualification to Closed Won | Sets expected close-date accuracy | Deals 1.5x the average cycle length need a manager review |
| Sales velocity | (Opportunities × Average deal size × Win rate) ÷ Sales cycle length | Measures revenue throughput | Use to compare segments, not just track over time |
Zendesk describes sales velocity as the metric that shows how quickly opportunities convert into revenue, and notes that improving any one of its four inputs, including win rate, average deal size, number of opportunities, or cycle length, will increase throughput.
Required coverage depends on your win rate. The formula is simple: required coverage is approximately the reciprocal of win rate; teams with lower win rates need more pipeline coverage to have a reasonable chance of hitting quota. Weighted-pipeline guidance makes this point explicitly and notes that SMB teams with faster cycles can operate at lower coverage ratios than enterprise teams.
Hygiene rules that keep your metrics trustworthy:
- Require a next-step date on every open deal. A deal with no next step is not a deal; it is a wish.
- Flag any deal that has not advanced a stage in 21 days as “at risk” automatically in your CRM.
- Review pipeline age weekly for deals in Proposal or later. Stale late-stage deals inflate your weighted forecast and create false confidence.
- Run a monthly data audit: delete or recycle any deal where the contact has gone dark for 45 days.
How weighted-pipeline forecasting works
Weighted-pipeline forecasting converts your raw opportunity list into a realistic expected revenue number by multiplying each deal’s value by its stage probability and summing the results. The formula is:
Weighted pipeline = Σ (deal value × stage probability)
B2B Sales Training’s weighted-pipeline primer explains that this method works only when stage probabilities are grounded in your own historical data, not generic defaults. Pull two to four quarters of closed deals, calculate the percentage that closed from each stage, and use those numbers as your probability weights.
Worked example:
- You have five open deals this quarter.
- Deal A: $80,000 at Proposal (40% probability) → weighted value: $32,000
- Deal B: $50,000 at Negotiation (65% probability) → weighted value: $32,500
- Deal C: $120,000 at Discovery (25% probability) → weighted value: $30,000
- Deal D: $30,000 at Qualification (15% probability) → weighted value: $4,500
- Deal E: $200,000 at Negotiation (65% probability) → weighted value: $130,000
- Total weighted pipeline: $229,000
If your quota is $300,000, this weighted number tells you that you are currently tracking short and need either more deals at the top of the funnel or a push to accelerate Deal C and Deal E.
Implementation rules that prevent forecast gaming:
- Filter by expected close date. Only include deals with a close date in the current quarter in your quarterly forecast. Deals slipping from last quarter need a separate review.
- Use separate probability tracks for renewals and expansions. A renewal at Proposal closes at a higher rate than a net-new deal at the same stage, so blending them distorts your forecast.
- Lock probability values in your CRM so reps cannot manually override them. Stage advancement drives the probability change, not rep judgment.
- Review your weighted pipeline against quota weekly. Teams that update weekly catch pipeline problems before they become quarter-ending surprises.
How to implement the pipeline in your CRM, step by step
Design is only half the work. The other half is getting the pipeline into your CRM and into your team’s weekly rhythm. Here is a practical implementation checklist.
Implementation checklist:
- Export your current open deals with stage, owner, deal value, close date, and last-activity date.
- Define your final stage list and write one-sentence exit criteria for each stage.
- Lock stage probabilities in the CRM. Remove the ability for reps to edit probability manually.
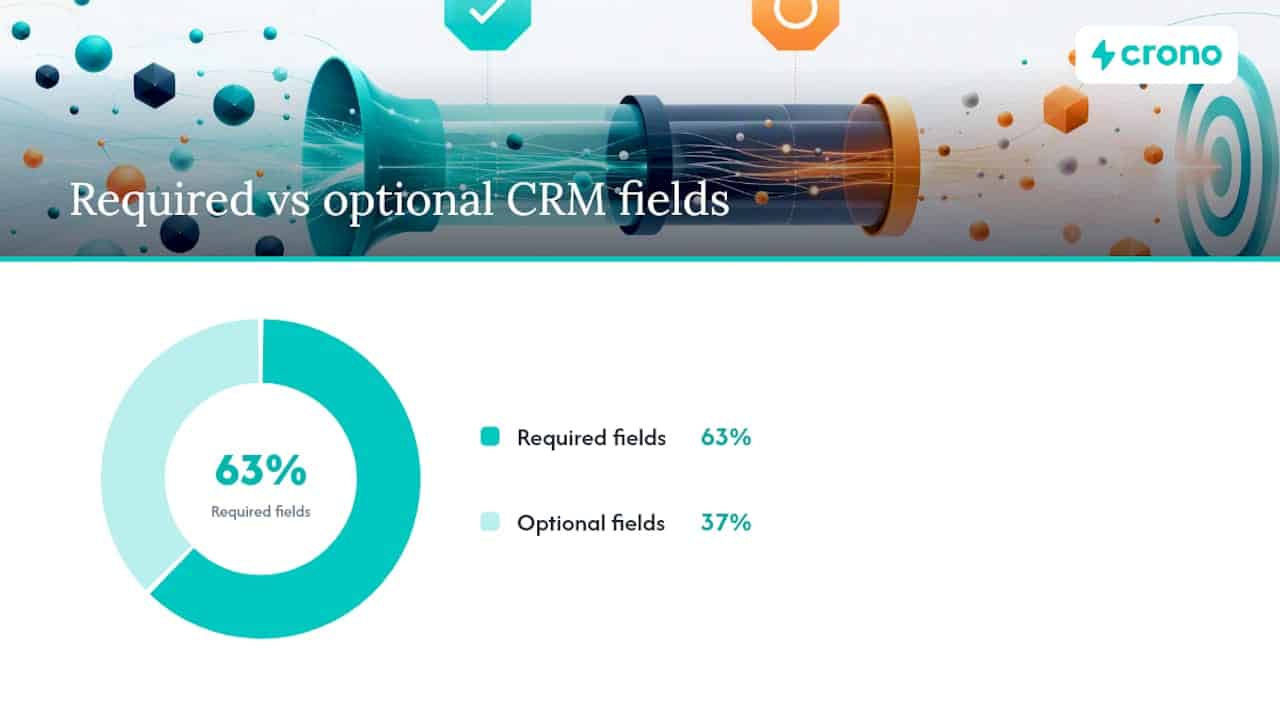
- Configure required fields: stage, probability (system-controlled), expected close date, deal owner, and pipeline type (new business, expansion, or renewal).
- Add optional fields: lead source, buying center contact, and competitor noted.
- Set up automation rules: flag deals with no activity in 21 days, send a Slack or email alert to the manager, and mark the deal “at risk.”
- Create a weekly pipeline review template in your meeting tool with a fixed agenda (see below).
- Run a one-hour team training session covering stage definitions, exit criteria, and the new hygiene rules.
- Schedule a 30-day check-in to review stage conversion data and adjust criteria where needed.
For prospecting tools that feed the top of your pipeline, 12 best sales prospecting software options covers the tools most commonly used by B2B teams to build and enrich contact lists before deals enter the CRM.
Manager playbook for weekly deal reviews:
- Review every deal in Proposal or later first. These are your commit deals and they need the most attention.
- For each deal, ask: What is the buyer’s next action? When is it due? What is blocking it?
- Flag any deal where the rep cannot name the decision-maker or the business case.
- Approve or reject any stage advancement where the exit criterion is unclear.
- End every review with a written list of the three deals most likely to close this week and the one deal most at risk of slipping.
Pro Tip: Integrate your pipeline data with your marketing team’s lead-nurturing workflows so that deals that stall in Qualification automatically trigger a targeted content sequence. This keeps the buyer warm without requiring rep effort. For a practical lead nurturing framework that aligns marketing and sales handoffs, the linked guide covers the core mechanics.
How to diagnose and fix pipeline bottlenecks
A healthy pipeline moves. Deals that sit in the same stage for weeks are not just a forecast problem; they are a signal that something in your process is broken. Coursera recommends using pipeline data to optimize performance and address blocks, which means you need a diagnostic routine, not just a reporting cadence.
Weekly diagnostic checklist:
- Coverage ratio: Is total pipeline value at least 3x quota (SMB) or 4x quota (enterprise)?
- Stage aging: Are any deals in Proposal or Negotiation older than 1.5x your average sales cycle?
- Conversion drop-offs: Which stage has the lowest stage-to-stage conversion rate this quarter?
- Velocity trend: Is your sales velocity improving, flat, or declining compared to last quarter?
Monthly diagnostic additions:
- Win rate by rep: Are any reps significantly below team average? That is a coaching signal, not just a pipeline signal.
- Loss reason analysis: What is the most common reason for Closed Lost? If it is “no decision,” your qualification criteria may be too loose.
- Pipeline age distribution: What percentage of your open pipeline is older than one full sales cycle? Anything above 30% suggests stale deals are inflating your numbers.
Common bottlenecks and how to fix them:
- Weak qualification. Deals enter Discovery without confirmed budget or authority. Fix: tighten your Qualification exit criteria to require a named budget owner and a stated business problem before advancement.
- Proposal stage stalls. Proposals go out and buyers go quiet. Fix: require a mutual action plan (MAP) with the buyer before sending the proposal, so both sides agree on next steps and timelines.
- No executive involvement on large deals. Enterprise deals stall because your rep is only talking to a champion, not a decision-maker. Fix: add an “Executive Alignment” milestone as a required exit criterion for deals above a defined deal-size threshold.
- Insufficient top-of-funnel volume. Coverage drops below target because not enough new deals are entering. Fix: run a targeted pipeline generation sprint using B2B sales automation tools to increase outreach volume without adding headcount.
- Stale deals inflating the forecast. Deals that should be Closed Lost remain open because reps are reluctant to mark them. Fix: implement an automatic decay rule that moves any deal with 45 days of no activity to a “Recycled” status and removes it from the active forecast.
For a deeper look at B2B sales strategies that address bottlenecks and improve deal movement, the linked resource covers the revenue-building methods that complement a well-governed pipeline.
Tools, templates, and resources to operationalize your pipeline
You do not need a sophisticated tech stack to run a clean pipeline. You need the right fields, a usable template, and a 90-day rollout plan that builds habits before it builds complexity.
Downloadable and reusable assets to build:
- Stage definitions document: one page listing each stage name, entry criterion, exit criterion, and suggested probability
- Probability mapping spreadsheet: a simple table showing stage name, historical close rate from that stage, and the locked probability value to use in your CRM
- Weighted forecast template: a spreadsheet with columns for deal name, stage, deal value, probability, weighted value, and expected close date
- 30/60/90-day rollout plan: a week-by-week checklist for the first 90 days of pipeline implementation
Required CRM fields (configure these before launch):
- Stage (picklist, required)
- Probability (numeric, system-controlled, not editable by reps)
- Expected close date (date, required)
- Deal owner (lookup, required)
- Pipeline type (picklist: New Business / Expansion / Renewal, required)
Optional CRM fields that add diagnostic value:
- Lead source (picklist)
- Buying center contact (lookup to a second contact record)
- Competitor noted (text or picklist)
- Loss reason (picklist, required on Closed Lost)
90-day rollout checklist:
| Week | Focus | Key actions |
|---|---|---|
| Week 1 | Data audit | Export open deals, identify stale records, document current stage distribution |
| Week 2 | Stage mapping | Finalize stage names, write exit criteria, assign probabilities from historical data |
| Week 3 | CRM configuration | Lock probabilities, configure required fields, set up automation and decay rules |
| Week 4 | Team training | Run stage-definition session, introduce weekly review cadence, set hygiene rules |
| Weeks 5–8 | Cadence building | Run weekly reviews, track stage conversion rates, identify first bottlenecks |
| Weeks 9–12 | Recalibration | Review probabilities against actual close rates, adjust stage criteria where needed |
For teams evaluating the broader outbound sales tech stack, the linked guide covers how CRM, enrichment, and engagement tools fit together for mid-market revenue teams.
How Crono operationalizes the pipeline into predictable revenue
A well-designed pipeline on paper still requires daily execution to produce results. Crono is built specifically for this gap: it connects your CRM and sales tools into a unified execution layer where AI agents and reps work together to keep deals moving.
What Crono does across the pipeline lifecycle:
- Data enrichment at the top of funnel. Crono enriches contact and account records automatically, so reps enter Qualification with verified data rather than guessing at titles and emails.
- Multichannel outreach orchestration. Crono coordinates LinkedIn, email, and call sequences so reps execute the right touch at the right stage without manually tracking what they sent last.
- AI-driven pipeline analytics. Crono surfaces deals at risk based on activity signals, stage age, and engagement patterns, giving managers a prioritized action list before the weekly review.
- Automated decay rules. Crono flags and recycles stale deals automatically, keeping your weighted forecast clean without requiring manual CRM hygiene from reps.
- Weighted forecast reporting. Crono generates commit reports that map directly to the weighted-pipeline formula, so managers see expected revenue by stage and by rep in one view.
Concrete use cases for pipeline managers:
- A deal sits in Proposal for 18 days with no buyer activity. Crono triggers an alert and suggests a re-engagement sequence tailored to the buyer’s last interaction.
- A rep’s pipeline coverage drops below 3x. Crono identifies accounts in the ICP that have not been contacted and queues them for outreach.
- A renewal deal approaches its contract date without advancing past Discovery. Crono escalates it to the manager and logs the risk in the weekly commit report.
For teams exploring AI sales agents as part of their pipeline execution model, Crono’s agentic approach connects signal detection, outreach, and CRM updates into a single workflow rather than requiring reps to manage each tool separately.
The case for starting smaller than you think
Most pipeline redesigns fail not because the design is wrong but because the rollout is too ambitious. Teams try to implement seven stages, twelve CRM fields, a new weekly review cadence, and automated decay rules all in the same month. Reps get confused, managers get frustrated, and the pipeline reverts to whatever it was before.
The better approach is a controlled pilot. Pick one segment, one product line, or one rep team. Run the new stage definitions and exit criteria for six weeks. Track one metric: stage conversion rate at the stage where deals most commonly stall. If it improves, you have proof the design works. Then expand.
The experiment template is simple: state your hypothesis (“tightening Qualification exit criteria will reduce the percentage of deals that stall in Proposal”), name the metric you will track (Proposal-to-Negotiation conversion rate), set a duration (six weeks), and define your sample (the deals that enter Qualification during that period). At the end of six weeks, you either have evidence to expand or evidence to adjust. Either outcome is useful.
Quarterly probability recalibration matters just as much as the initial setup. Stage probabilities drift as your market, product, and competitive position change. A probability you set based on last year’s data may be meaningfully wrong by Q3. Build a 90-minute recalibration session into your quarterly business review, pull the last two quarters of closed data, and update your weights before the next quarter begins.
Weekly hygiene checks are not optional governance overhead. They are the mechanism that keeps your forecast honest. A pipeline that is reviewed weekly catches problems in time to fix them. One that is reviewed monthly catches them in time to explain them.
Crono turns your pipeline playbook into daily execution
Pipeline design is the strategy. Execution is where revenue is actually made, and that is where most teams lose ground. Crono gives revenue teams a single platform that connects CRM data, buying signals, AI agents, and multichannel outreach so the playbook you just built runs automatically rather than depending on rep discipline alone.
With Crono, you get automated deal-risk alerts tied to your stage definitions, weighted forecast reports that update in real time, and AI-driven outreach sequences that trigger based on deal stage and buyer engagement. The result is faster stage progression, cleaner forecast data, and post-sale handoffs that do not require a manager to chase down notes.
Teams that want to see how outbound sales automation fits into a pipeline-driven revenue model can explore Crono’s full execution layer. For managers ready to move from design to action, Crono’s sales engagement guide walks through how AI-powered orchestration connects every stage of the pipeline to a repeatable, measurable process. Request a demo and bring your current stage definitions with you.
Primary sources and further reading
The sources below were used throughout this guide. Each one covers a distinct aspect of pipeline design and management.
- TechTarget: What is a sales pipeline? — Best for the canonical definition, stage sequencing, and the role of CRM automation in pipeline hygiene.
- B2B Sales Training: What Is Weighted Pipeline and How to Use It — Best for the weighted-pipeline formula, coverage ratio math, and probability-setting methodology.
- Coursera: Sales Pipeline Management — Best for KPI definitions, conversion metrics, and the recommendation to integrate pipeline data with marketing and customer success.
- IBM THINK: What is a sales pipeline? — Best for the buyer-milestone framing of stage definitions and the planning-and-execution model.
- Zendesk: What is sales velocity? — Best for the sales velocity formula, its four components, and how to use it as an operational improvement metric.
- Adobe: A guide to the sales pipeline — Best for the pipeline vs. funnel distinction and when to use each model.
- LinkedIn Sales Solutions: Sales Pipeline Guide for Sales Leaders — Best for practical stage sequencing used by B2B sellers and stage-name conventions.
Sources
- What is a sales pipeline? | Definition from TechTarget
- What Is Weighted Pipeline and How to Use It
- Sales Pipeline Management: A Comprehensive Guide | Coursera
- What is a sales pipeline? | IBM THINK
- What is sales velocity? Meaning, formula, and report | Zendesk Singapore
