

Sales velocity is defined as the rate at which your pipeline converts opportunities into closed revenue, expressed as dollars generated per day. It is the single metric that tells B2B sales leaders not just how much they are selling, but how fast and how efficiently. Companies that track sales velocity show 25% higher growth than teams focused on isolated metrics like win rate or pipeline coverage alone.
That gap exists because velocity forces you to see your entire revenue engine as a system, not a collection of disconnected numbers. Understanding why sales velocity matters in B2B is the first step toward fixing the right problems at the right time.
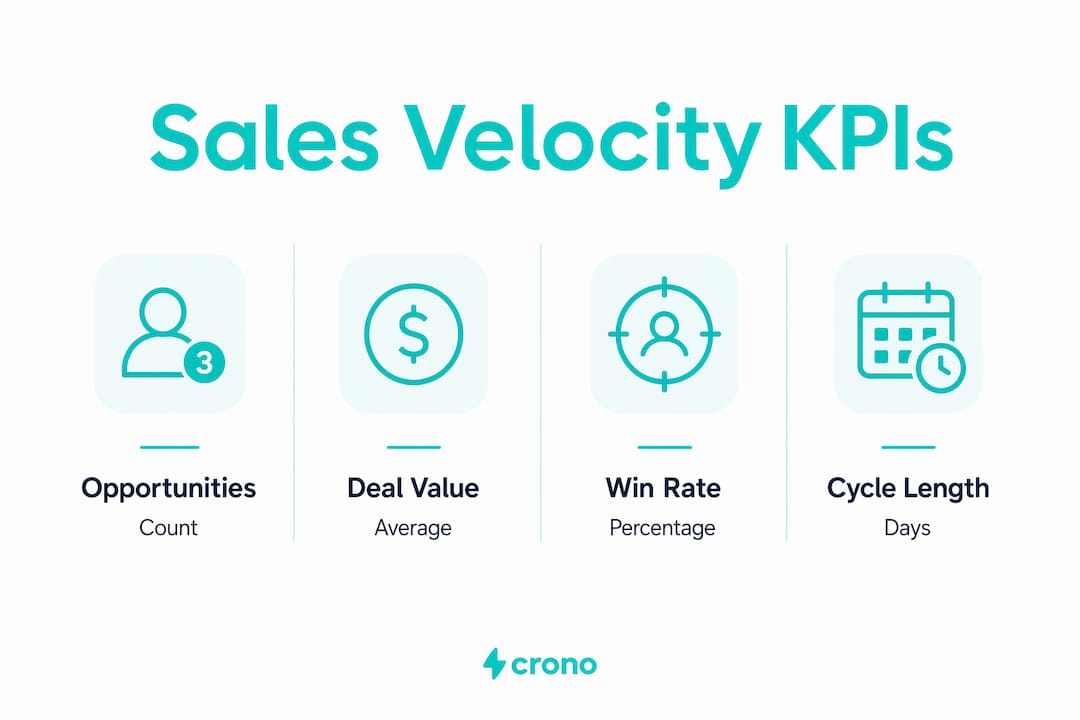
What are the four components of sales velocity and how do they interact?
Sales velocity is calculated with one formula: (Opportunities × Average deal value × Win rate) ÷ Sales cycle length in days. Each variable is a lever. Pull one, and the output changes. Pull the wrong one without understanding the others, and you can actually hurt your overall velocity.
Breaking down each lever
Opportunity count is the number of active, qualified deals in your pipeline at any given time. More qualified opportunities raise the numerator directly. The keyword here is qualified. Stuffing your pipeline with low-fit leads inflates the count but crushes win rate, which offsets any gain.

Average deal value multiplies every other improvement you make. A 10% increase in deal size produces a 10% lift in velocity with no other changes. This is why B2B lead scoring matters so much. Prioritizing higher-value ICP accounts before they enter the pipeline raises deal value at the source.
Win rate reflects how often qualified opportunities close in your favor. A team closing 30% of deals at $50,000 each generates more velocity than a team closing 20% at the same deal size. Win rate improvements compound with every other lever.
Sales cycle length is the denominator. Shortening cycle time raises velocity even when all other inputs stay constant. This makes it the highest-leverage lever in the formula. A deal that closes in 30 days instead of 60 days doubles the velocity contribution of that single opportunity.
Scenario comparison: how each lever shifts velocity
| Scenario | Opportunities | Avg. Deal Value | Win Rate | Cycle (days) | Velocity ($/day) |
|---|---|---|---|---|---|
| Baseline | 50 | $10,000 | 25% | 60 | $2,083 |
| +20% opportunities | 60 | $10,000 | 25% | 60 | $2,500 |
| +20% deal value | 50 | $12,000 | 25% | 60 | $2,500 |
| +10% win rate | 50 | $10,000 | 35% | 60 | $2,917 |
| Cycle cut by 30% | 50 | $10,000 | 25% | 42 | $2,976 |
The table shows that cutting cycle time by 30% produces a larger velocity gain than adding 20% more opportunities or 20% more deal value. That is a counterintuitive result most sales leaders have never seen laid out this clearly.
Pro Tip: Before adding headcount to generate more pipeline, audit your average sales cycle first. Cutting 15 days off a 60-day cycle often delivers more revenue per day than hiring another SDR.
Why sales velocity beats win rate or pipeline coverage as a diagnostic
Sales velocity is normalized by time, which makes it the only metric that allows a true apples-to-apples comparison across teams, segments, and deal sizes. Win rate and pipeline coverage cannot do this.
Consider two reps. Rep A closes $50,000 enterprise deals at a 20% win rate over 90 days. Rep B closes $5,000 SMB deals at a 40% win rate over 15 days. Comparing these by win rate alone makes Rep B look superior. Velocity tells a different story by measuring dollars generated per day for each rep, giving leadership a fair basis for comparison and resource decisions.
Velocity also exposes efficiency problems that activity metrics hide entirely. A team can show strong pipeline coverage and still generate poor revenue if deals are stalling in late stages. Velocity catches that stall immediately because the cycle length grows while the numerator stays flat.
“Sales velocity should be treated as a system with four measurable levers, focusing revenue leaders on operational improvements, not just outcomes.” — Fullcast
The advantages of velocity over traditional metrics are concrete:
- Cross-segment comparability. Velocity converts all deal types into one daily revenue number, removing the distortion of comparing different deal sizes or markets.
- Early warning signal. A drop in velocity this week signals a problem that will show up in quarterly revenue six to eight weeks later. Win rate alone does not give you that lead time.
- Lever-specific diagnosis. When velocity drops, you can isolate which of the four inputs caused it. Pipeline coverage just tells you the number is low.
- Forecasting precision. Velocity × remaining days in the period equals expected revenue. Tools like HubSpot and Clari use this calculation to replace gut-based forecasts with data-driven projections.
Common pitfalls in tracking and interpreting sales velocity
Measuring velocity incorrectly is worse than not measuring it at all. Bad velocity data produces confident, wrong decisions.
Poor data hygiene is the most common source of error. When reps fail to update deal stage dates in the CRM, closed or stalled deals continue to accumulate cycle time. This artificially inflates average cycle length and makes your velocity look worse than it actually is. The fix is a strict CRM update discipline enforced at the team level, not left to individual rep behavior.
The second major pitfall is using blended velocity numbers. A single company-wide velocity figure can hide serious trade-offs. If your enterprise segment improves win rate but cycle time grows, and your SMB segment moves faster but deal size shrinks, the blended number may look flat. Segmenting velocity by rep, market segment, or ICP tier reveals these hidden dynamics.
Common tracking errors to avoid:
- Stale stage dates. Audit CRM stage timestamps weekly. Any deal that has not moved in 14 days needs a manual review.
- Blended averages. Always break velocity down by segment before drawing conclusions. A flat company number can mask a collapsing enterprise segment.
- Ignoring outlier deals. One unusually large deal closing in a short cycle can spike velocity artificially. Remove statistical outliers before reporting trends.
- Quarterly cadence. Teams that review velocity monthly or quarterly miss the early warning window entirely.
Pro Tip: Set a weekly velocity review as a standing agenda item in your revenue operations meeting. Flag any week-over-week drop greater than 10% as a trigger for a lever-by-lever diagnostic.
How to use sales velocity to accelerate B2B sales growth
Tracking velocity weekly correlates to 34% higher revenue growth compared to quarterly tracking. The reason is simple. Weekly visibility gives you time to intervene before a slow quarter becomes a missed target.
The practical approach is to assign each of the four levers to a specific owner and a specific intervention. The table below maps each lever to a concrete action.
| Velocity lever | Symptom | Targeted intervention |
|---|---|---|
| Opportunity count | Pipeline below target volume | Increase outbound sequences, improve ICP targeting |
| Average deal value | Deals skewing small | Upsell at discovery, qualify for budget earlier |
| Win rate | High activity, low close rate | Improve demo quality, add competitive battle cards |
| Sales cycle length | Deals stalling in late stages | Add urgency triggers, reduce approval steps |
Cycle time reduction deserves special attention. B2B deals closed in under a week win at a 29% rate. Deals that take 8 to 14 days win at 61%. Deals that stretch beyond 60 days win at only 4%. This data confirms that speed itself is a competitive advantage, not just a byproduct of a good process.
AI tools change the velocity equation at the execution layer. AI-powered sales agents can handle follow-up sequences, surface deal risk signals, and trigger next-step recommendations without waiting for a rep to notice a stall. Platforms built for sales cycle optimization in B2B combine data enrichment, multichannel engagement, and workflow automation to reduce the manual friction that inflates cycle time.
Velocity also connects directly to forecasting. The formula is straightforward: current velocity multiplied by remaining days in the period equals projected revenue. This replaces subjective pipeline reviews with a number grounded in actual deal movement. Revenue leaders who use this approach can reallocate resources mid-quarter rather than waiting for end-of-quarter surprises.
Key Takeaways
Sales velocity is the most complete diagnostic metric in B2B sales because it combines opportunity volume, deal value, win rate, and cycle time into a single daily revenue figure that exposes exactly where your pipeline is losing speed.
| Point | Details |
|---|---|
| Use the four-lever formula | Calculate velocity as (Opportunities × Deal value × Win rate) ÷ Cycle days to find your baseline. |
| Prioritize cycle time reduction | Cutting cycle length raises velocity faster than adding pipeline volume or increasing deal size. |
| Segment before you conclude | Blended velocity numbers hide trade-offs; always break down by rep, segment, or ICP tier. |
| Track weekly, not quarterly | Weekly velocity reviews give you time to intervene before a slow period becomes a missed quarter. |
| Connect velocity to forecasting | Multiply current velocity by remaining days in the period to replace gut estimates with data. |
Sales velocity changed how I think about revenue leadership
I spent years watching sales leaders obsess over win rate. It is an understandable fixation. Win rate feels like a direct measure of sales quality. But win rate tells you nothing about speed, and speed is where most B2B revenue is actually lost.
The shift happens when you start treating your pipeline as a system with four inputs, not a funnel with one output. When velocity drops, you stop asking “why aren’t we closing more?” and start asking “which lever moved?” That question leads to a specific answer and a specific fix. It is a fundamentally different kind of leadership conversation.
What I have also observed is that velocity creates better alignment between sales, marketing, and revenue operations. Marketing can see directly how their lead quality affects cycle time and win rate. RevOps can model the impact of a new qualification framework before it rolls out. Sales leadership can defend resource requests with a number, not a feeling.
The caution I would offer is this: do not push velocity metrics down to individual rep scorecards too aggressively. Reps who are measured on velocity will sometimes rush deals that need more time, or avoid complex accounts that would genuinely move the business forward. Velocity is a team and segment-level diagnostic. Use it to guide coaching and process changes, not to rank individual performance in a way that creates perverse incentives.
The teams I have seen grow fastest are the ones that treat velocity as a weekly operating rhythm, not a quarterly report. They catch problems early, fix the right lever, and compound those improvements over time. That is the real value of this metric.
How Crono helps you act on sales velocity insights
Knowing your velocity number is only useful if you can act on it. Crono is built as an Agentic Sales Engine that connects signals, data, and execution in one platform. AI agents inside Crono monitor deal movement, flag stalls, and trigger multichannel follow-up sequences automatically, which directly reduces the cycle time that sits in your velocity denominator.
Sales teams using Crono can run AI sales agents in B2B workflows to handle the execution layer while reps focus on high-value conversations. For leaders who want to go deeper on process, Crono’s sales orchestration framework maps each of the four velocity levers to specific automation and engagement workflows. The result is a revenue team where velocity improvements are built into the system, not dependent on individual rep discipline.
FAQ
What is the sales velocity formula?
Sales velocity equals (Opportunities × Average deal value × Win rate) ÷ Sales cycle length in days. The result is your daily revenue generation rate.
Why does sales cycle length have such a large impact on velocity?
Cycle length is the denominator in the velocity formula. Cutting it by 30% raises velocity by roughly 43% with no other changes, making it the highest-leverage input in the equation.
How often should B2B teams track sales velocity?
Weekly tracking correlates to 34% higher revenue growth compared to quarterly tracking. Weekly reviews give teams enough lead time to intervene before a slow period compounds into a missed quarter.
How is sales velocity different from pipeline coverage?
Pipeline coverage measures total deal value relative to quota. Sales velocity measures how fast that pipeline converts into revenue per day, which exposes efficiency and cycle time issues that coverage ratios miss entirely.
Can sales velocity be used for revenue forecasting?
Yes. Multiplying current velocity by the number of remaining days in a period produces a data-driven revenue projection. CRM platforms like HubSpot and Clari use this calculation to replace subjective pipeline estimates.
