⚡️Bolt - The B2B Sales newsletter by Crono
Subscribe to our newsletter to receive monthly updates and insights on the future of B2B Sales!
Revenue is the total money a business brings in from selling goods or services, before anything gets subtracted. Profit is what’s left after every cost, from materials to taxes, gets paid. One industry definition puts it plainly: revenue is the top line, profit is the bottom line, and confusing the two is one of the most common mistakes new business owners and students make.
The formulas are short enough to memorize in ten seconds:
Revenue = Price × Units Sold
Net Profit = Revenue − (COGS + Operating Expenses + Interest + Taxes)
That gap between the two numbers isn’t just accounting trivia. It tells you two completely different stories about a business:
A company can grow revenue every quarter and still lose money. It happens more often than most people assume, and understanding why is the difference between reading a financial statement and actually understanding one.
Revenue measures how much money a business brings in, while profit measures how much of it actually remains after covering every cost, and neither number alone tells you whether a business is healthy.
| Point | Details |
|---|---|
| Revenue is the top line | It reflects total sales before any costs are subtracted, and shows demand. |
| Profit is the bottom line | It’s what remains after COGS, operating expenses, interest, and taxes. |
| Check margins, not just totals | Gross, operating, and net margins reveal where money leaks out. |
| Track cost drivers separately | Fixed and variable costs behave differently as sales volume changes. |
| Align growth with unit economics | Revenue growth that outpaces cost control usually erodes profit over time. |
Revenue is the income a business earns from its core operations, before any costs are deducted. It’s distinct from non-operating income like interest earned on a savings account or a one-time gain from selling equipment. If a coffee shop earns $500,000 selling drinks and pastries in a year, that $500,000 is revenue. Interest the owner earned on a business savings account doesn’t count as revenue. It’s non-operating income.
Most businesses draw revenue from a mix of sources, and the labels matter because they signal different things about the business model:
Companies also distinguish between gross revenue and net revenue. Gross revenue is every dollar that came in before adjustments. Net revenue subtracts returns, discounts, and allowances. A clothing retailer that sold $1,000,000 worth of goods but issued $40,000 in refunds reports $960,000 in net revenue, and that second number is the one that actually reflects sales performance.
Timing matters too. Under accrual accounting, revenue gets recorded when it’s earned, not when cash actually lands in the bank. A software company that signs a $120,000 annual contract in January might recognize it as $10,000 per month over the year rather than one lump sum, and that choice, cash versus accrual, can shift reported revenue significantly from one period to the next even when nothing about the underlying sales has changed.
Profit isn’t a single number. It’s a series of numbers, each one revealing a different layer of how a business spends money. Think of it as peeling back costs one category at a time until you reach what’s genuinely left over.
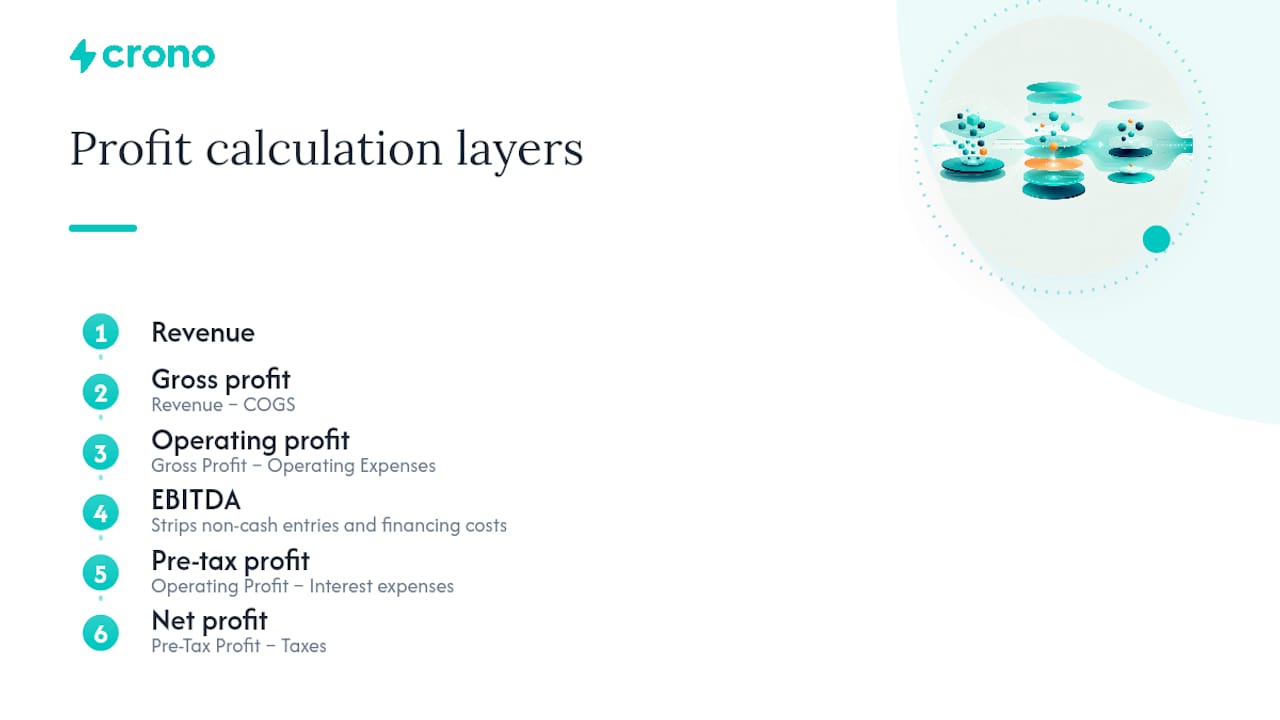
Gross profit is the first stop. It’s revenue minus the direct cost of producing whatever you sold, known as cost of goods sold (COGS).
Gross Profit = Revenue − COGS
If a bakery earns $200,000 in revenue and spends $80,000 on flour, sugar, and labor directly tied to baking, gross profit is $120,000. This number tells you how efficiently the core product is made and priced, before you account for rent, marketing, or salaries.
Operating profit goes further. It subtracts operating expenses, the ongoing costs of running the business that aren’t tied directly to production, like marketing, administrative salaries, and rent.
Operating Profit = Gross Profit − Operating Expenses
EBITDA (earnings before interest, taxes, depreciation, and amortization) strips out non-cash accounting entries and financing costs to show how the core operation performs on a cash basis. Investors and analysts lean on this figure heavily when comparing companies with different debt loads or tax situations, since it neutralizes those variables.
Pre-tax profit subtracts interest expenses from operating profit, showing earnings before the tax bill hits. Net profit, the true bottom line, subtracts taxes on top of that.
Net Profit = Pre-Tax Profit − Taxes
One more distinction worth knowing: fixed costs like rent stay the same regardless of sales volume, while variable costs like raw materials rise and fall with production. That split explains why gross margin can hold steady while net margin swings wildly. Fixed costs get absorbed the same way no matter what, but variable costs scale directly with how much you sell.
Every income statement follows the same waterfall structure, moving from the biggest number at the top to the smallest at the bottom. Revenue sits first. Net profit sits last. Everything in between subtracts a specific category of cost, and the SEC’s own investor guide walks through this exact layout because understanding it is fundamental to reading any public company’s financials.

Here’s what that looks like for a small furniture maker with $500,000 in annual sales:
That’s not a sign of a badly run business; it’s simply what the full cost structure looks like once materials, staff, rent, debt, and the government all take their share.
Scale that pattern up and the gap gets even more dramatic. Amazon reported $637.96 billion in revenue and $59.25 billion in profit for fiscal year 2024, meaning roughly 91% of every revenue dollar went toward costs before profit was counted. Massive revenue and modest relative profit margins can coexist at any scale, from a neighborhood bakery to a trillion-dollar retailer.
The two metrics measure fundamentally different things, and mixing them up leads to bad decisions. Here’s how they stack up side by side.
| Dimension | Revenue | Profit |
|---|---|---|
| What it measures | Total sales activity and demand | Money remaining after all costs |
| Position on income statement | Top line | Bottom line |
| Affected by | Pricing, volume, market demand | Costs, taxes, interest, accounting choices |
| Decision uses | Sizing the market, tracking growth | Assessing sustainability, funding reinvestment |
A few misconceptions trip people up constantly:
That last point deserves emphasis. Accounting choices, like how a company depreciates equipment or amortizes an acquisition, can swing reported profit substantially without touching revenue at all. Revenue is comparatively hard to manipulate because it’s tied to actual sales transactions. Profit runs through more accounting judgment calls, which is exactly why analysts read profit figures more skeptically than revenue figures.
Numbers make more sense with real examples. Here are two, one for a product business and one for a service business, worked all the way through.
Example 1: A product business (handmade candle shop)
Example 2: A service business (freelance marketing consultant)
Notice how the service business runs a far higher margin than the candle shop. Service businesses typically carry lower direct costs since they’re selling expertise and time rather than physical materials, which is why margin percentages vary so widely between industries and why comparing raw profit dollars across different business types tells you very little.
Margins turn raw dollar figures into percentages you can compare across time periods, competitors, or industries. Each one isolates a different layer of the cost structure, and reading them together, rather than picking a favorite, is how margin analysis is meant to work.
| Margin | Formula | What It Isolates | When Managers Use It |
|---|---|---|---|
| Gross margin | Gross Profit ÷ Revenue | Production and pricing efficiency | Setting prices, evaluating suppliers |
| Operating margin | Operating Profit ÷ Revenue | Core business efficiency, excluding financing | Comparing operational health year over year |
| EBITDA margin | EBITDA ÷ Revenue | Cash-generating ability, excluding financing and accounting non-cash items | Comparing companies with different debt or depreciation schedules |
| Net margin | Net Profit ÷ Revenue | True bottom-line profitability after everything | Assessing overall financial health and investor returns |
Pro Tip: Never diagnose a business off one margin alone. A healthy gross margin paired with a weak operating margin usually points to bloated overhead, not a pricing problem, while a strong operating margin with a weak net margin often signals a debt or tax issue rather than anything wrong with how the business actually runs.
This is the scenario that confuses people most, and it shows up constantly in fast-growing companies, especially venture-backed startups chasing market share over profitability.
Several factors commonly drive this pattern:
The reverse pattern happens too, and it’s worth recognizing because it’s often a sign of genuine operational discipline. A company posts flat or even declining revenue but improving profit because it cut unnecessary costs, renegotiated a major supplier contract, or raised prices on products with low price sensitivity.
If customer acquisition costs and salaries grow faster than that 40%, net profit can shrink even as the top line looks impressive on an investor slide deck. That gap between the growth story and the profit story is exactly why rapid expansion doesn’t automatically translate into a sustainable business.
These require genuinely different playbooks. Revenue growth is about reaching more customers or extracting more value per customer. Profit improvement is about spending less to deliver what you already sell.
Revenue levers to pull:
Profit levers to pull:
Pro Tip: If you’re deciding where to focus first, fix profit leaks before pouring money into growth. Scaling a business with a broken cost structure just multiplies the losses faster. Get the margin healthy on a small scale, then grow it.
Investors and finance teams don’t look at revenue or profit in isolation. They track a specific cluster of ratios because changes in those ratios, more than the headline numbers themselves, tend to move how a company gets valued.
The ratio set worth watching includes:
Research on margin ratio analysis points out that managers increase company value through four main levers: revenue growth, operational effectiveness, investment efficiency, and financing strategy, and margin ratios help identify which of those levers is actually working versus which one is dragging performance down. A company with strong revenue growth but a declining operating margin, for instance, is telling you that growth is coming at the expense of efficiency, a pattern worth catching early rather than after a few bad quarters.
The diagnostic checklist is simple enough to run on your own numbers in ten minutes: pull your revenue growth rate for the last four quarters, calculate gross and operating margin for each, and flag any quarter where margin dropped by more than a few percentage points even as revenue rose. That gap is where the real story lives, and it’s usually more informative than the headline growth number by itself.

A handful of sources are worth bookmarking if you want to go deeper on this topic beyond what’s covered here.
These sources cover the fundamentals well; the sections above already worked through the specific formulas and citations that matter most for a practical understanding.
Most people treat revenue and profit as two versions of the same idea: bigger is better. That instinct causes real damage. I’ve seen the same mistake play out across pitch decks, board meetings, and family businesses alike, where a rising revenue chart gets treated as proof of success while the profit line, sitting quietly below it, tells a completely different story.
The uncomfortable truth is that revenue is the easier number to grow and the easier one to manipulate through discounting, aggressive sales incentives, or simply spending more on acquisition. Profit is harder to fake because it requires the entire cost structure underneath it to actually hold together. That’s exactly why sophisticated investors read margin trends over multiple quarters instead of getting excited about a single strong revenue headline.
If there’s one habit worth building from everything above, it’s this: never look at a revenue number without immediately asking what the corresponding margin looks like. It’s a warning that costs are quietly outrunning growth, and the businesses that catch that gap early are the ones that survive long enough to actually enjoy the growth they’re chasing.
Pro Tip: Run your margin analysis quarterly, not annually. Cost creep is gradual, and by the time an annual review catches a shrinking margin, you’ve often already lost a full year of avoidable losses.
This article is general information, not a substitute for advice from a qualified financial advisor. Consult a qualified financial professional about your own circumstances before acting on anything here.