
There is no single good outbound conversion rate, because every stage of the funnel has its own range. Recent B2B reports put cold email positive reply rates around 1.8%, cold call connect rates between roughly 7% and 42% depending on how they are counted, and opportunity-to-close rates of 15-25% for new business. A rate is only “good” when you know the stage, the denominator and the deal size behind it. At Crono we build our execution layer around that idea: measure each stage on a shared definition, then fix the stage that leaks most.
TL;DR
- Benchmarks only mean something per stage: connect, reply, meeting, opportunity and closed-won each have a different normal range.
- Recent reports show a median positive reply rate near 1.8%, a reply-to-meeting rate near 14.5% and a meeting show rate near 68%.
- Opportunity-to-closed-won averages 15-25% for new business, lower in enterprise and higher in SMB.
- 2.5% and 7% are good or poor depending on the stage you are measuring, so name the denominator before comparing.
- Data quality, ICP fit and multichannel coverage move your numbers more than any copy tweak.
Table of Contents
- What outbound conversion benchmarks actually measure
- Benchmarks by funnel stage
- Is 2.5% a good outbound conversion rate?
- Is 7% a good outbound conversion rate?
- Why benchmarks vary so much between teams
- How to calculate and compare your own rates
- A worked example: finding the leak
- What moves each stage
- Our perspective
- Put your own funnel on one page
- FAQ
- Sources
What outbound conversion benchmarks actually measure
A stage conversion rate is the number of prospects who enter the next stage divided by the number who entered the current stage, times 100. Digital Sales Pro lays out this formula and stresses that the stages must be defined before any rate is compared.
A typical outbound funnel has these stages:
- Contact added: the account or person enters your target list.
- Contact reached: a call connects or an email gets a human response.
- Positive reply or conversation: the prospect shows interest or has a real discussion.
- Meeting held: the call or demo actually happens, not just gets booked.
- Qualified opportunity: the meeting meets your agreed qualification criteria.
- Closed-won: the deal signs.
The trap is that published benchmarks start and stop at different places. One report divides by emails sent, another by emails delivered, another by contacts added. A “reply rate” that includes out-of-office messages and one that counts only interested answers can differ by a factor of two or more. Before you compare yourself to any number, write down its numerator and its denominator.
Benchmarks by funnel stage
The ranges below come from 2026 reports on US-heavy B2B outbound. Treat them as orientation points, not targets. The datasets differ in industry, deal size and method, which is exactly why the spread is wide.
| Stage | Benchmark | Notes |
|---|---|---|
| Cold call connect rate | 42.1% in one dataset of 56,604 calls; 7.1% in a separate sample of 59,777 dials | Depends on list quality, direct dials and how a “connect” is counted |
| Email response rate | 7.0% across 87,015 emails in the same first dataset | Any response, not only positive ones |
| Positive reply rate | Median 1.8% for executive-targeted campaigns | Interest or request for information |
| Reply to meeting | 14.5% median | Of replies that turn into a booked meeting |
| Meeting show rate | 68.0% scheduled to attended | Reminders and confirmation lift it |
| Connect to conversation (calls) | 27% in the 4,265-connection sample | Conversations with ICP-fit contacts |
| Conversation to booking (calls) | 4.0% (46 meetings from 1,150 conversations) | Same sample |
| Lead to MQL | 20-25% | Per one 2026 benchmark roundup |
| MQL to SQL | 12-18% | Same roundup |
| SQL to opportunity | 10-12% | Same roundup |
| Opportunity to closed-won | 15-25% new business; 10-20% enterprise; 25-35% SMB | Same roundup |
The same dataset that reports the 7.0% email response rate also shows an observed interest rate of 1.7% and a cost per sales opportunity of $460 to $520. The show-rate report puts the average cost per attended call at $780 for in-house teams. Those cost figures are useful for one reason: they tell you what a one-point change in any stage is worth.
Is 2.5% a good outbound conversion rate?
It depends entirely on the stage. One 2026 guide calls a 2.5% dial-to-meeting rate on cold calls average, and says what counts as good depends on your market, deal size and how reachable your ICP is.
Run the same 2.5% through other stages and the verdict changes:
- As a positive reply rate on email: above the 1.8% median in the executive-targeted data, so strong.
- As a dial-to-meeting rate: average, with room to improve through better contact data and timing.
- As a meeting-to-opportunity rate: very low. Most teams expect a far higher share of held meetings to qualify.
- As a lead-to-close rate for enterprise deals: possibly excellent, since enterprise opportunity-to-close rates sit at 10-20% and the earlier stages filter heavily.
The question to ask is not “is 2.5% good?” but “2.5% of what, and compared with what for this deal size?”
Is 7% a good outbound conversion rate?
The same logic applies, and the research shows why 7% is a particularly slippery number. In the data above, 7.0% is an observed email response rate, and 7.1% is a cold call connect rate in a different sample. Those are two unrelated measurements that happen to share a digit.
Here is how to read 7% by stage:
- Email response rate: healthy, because it sits in line with the 7.0% observed across 87,015 emails. If it is a positive reply rate, it is well above the 1.8% median and worth documenting so you can repeat it.
- Call connect rate: typical for a cold dial list in the personal-blog sample, though lower than the 42.1% seen in another dataset. A gap that large usually points to list quality and how connects are defined.
- Reply to meeting: below the 14.5% median, so look at how you handle interested replies.
- Meeting to opportunity: low for most B2B teams.
If someone quotes you a 7% conversion rate without a stage, treat the number as incomplete. Ask what the numerator and denominator were.
Why benchmarks vary so much between teams
Three structural reasons explain most of the spread.
Context changes the baseline. Conversion rates vary by industry, price point, sales cycle length and how warm the traffic is, so averages need context. That is also why comparing inbound and outbound rates head-to-head is often meaningless: the buyer’s intent at the start of the funnel is fundamentally different. Compare them at a shared point such as a sales-accepted lead or a qualified opportunity.
Data quality compounds through every stage. B2B contact data decays at about 2.1% per month, or 22.5% a year. A list that was accurate in January has lost roughly a fifth of its value by December. Bounces hurt deliverability, wrong numbers depress connect rates, and stale titles send the wrong message to the wrong person.
Definitions differ. Studies count different things, so compare against definitions rather than a headline figure. Agreeing internally on what counts as a qualified opportunity removes noise and makes your own rate comparable from quarter to quarter.
Other drivers include ICP fit, deal size, timing and whether you coordinate email, LinkedIn and calls rather than running them in separate silos.
How to calculate and compare your own rates
Your own trend line is a better benchmark than any industry table. Here is a routine that works.
- Fix your stage definitions. Write down what counts as a reply, a positive reply, a held meeting and a qualified opportunity. Put them where reps and RevOps can both see them.
- Pick one denominator per channel. For email, use emails delivered. For calls, use dials. Do not mix them mid-quarter.
- Calculate every stage separately. Divide the count entering the next stage by the count entering the current one. Keep the raw counts next to the percentages so small samples are obvious.
- Compare against yourself first. Look at the last three months by segment, persona and channel. Only then look at published ranges.
- Find the stage with the largest gap from baseline. One analysis argues each stage has a dominant variable, and you should invest where variance from baseline is largest.
- Check meeting quality. A booked meeting that never becomes a qualified opportunity is calendar stuffing and wastes resources, however good the booking number looks.
The weak point of this routine is the data work. Stage definitions drift, activities live in three tools, and the numbers only agree after someone spends a Friday reconciling them. This is where we designed Crono to help: it connects your CRM and sales tools in one execution layer, so the counts at each stage come from the same place your reps work.
A worked example: finding the leak
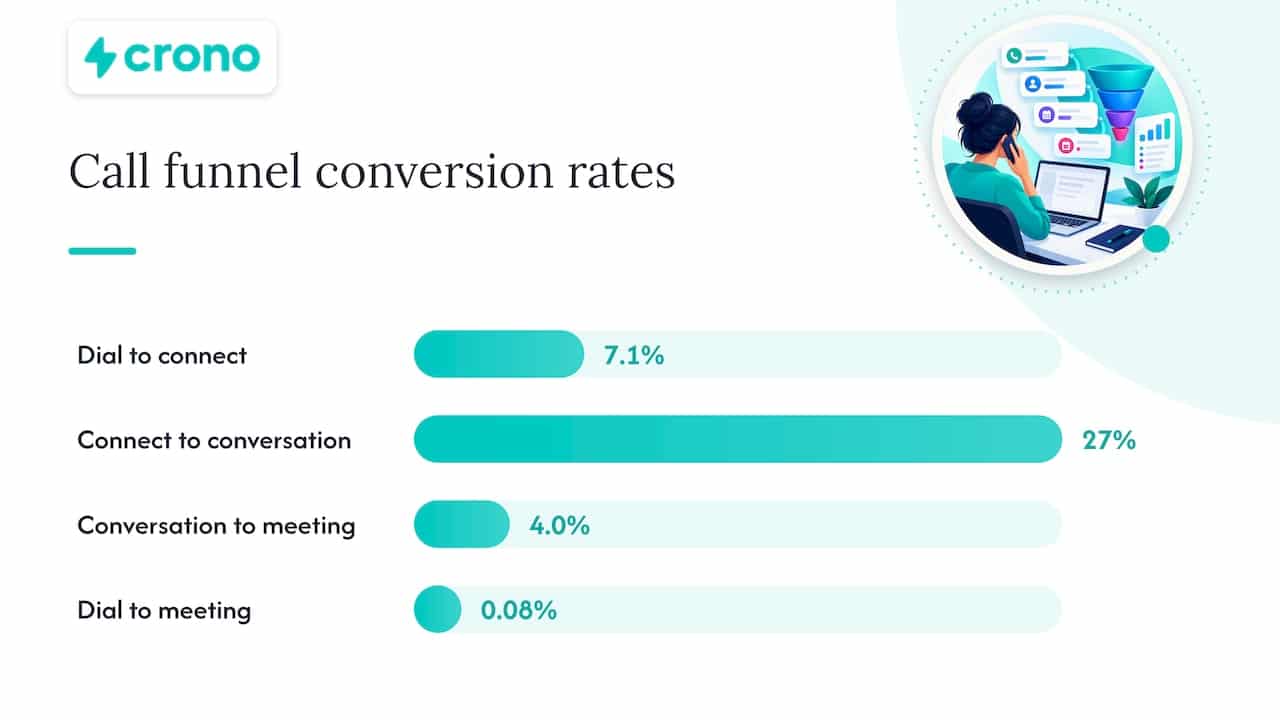
Take the call sample from the table: 59,777 dials, 4,265 connections, 1,150 ICP conversations and 46 meetings.
- Dial to connect: 4,265 / 59,777 = 7.1%
- Connect to conversation: 1,150 / 4,265 = 27%
- Conversation to meeting: 46 / 1,150 = 4.0%
- Dial to meeting overall: 46 / 59,777, about 0.08%
An overall figure that small hides where the work is. Lifting the connect rate from 7.1% to 10% on the same 59,777 dials would produce about 5,978 connections instead of 4,265. At the same downstream rates, that is roughly 1,614 conversations and 64 meetings instead of 46. A smaller improvement at one early stage can beat a large improvement on a late stage that has little volume left to work with.
Now add cost. If a sales opportunity costs between $460 and $520, as in the first dataset, every stage improvement is worth the cost saved per opportunity multiplied by your monthly volume. That is the number that justifies a tooling or data decision to a CRO.
What moves each stage
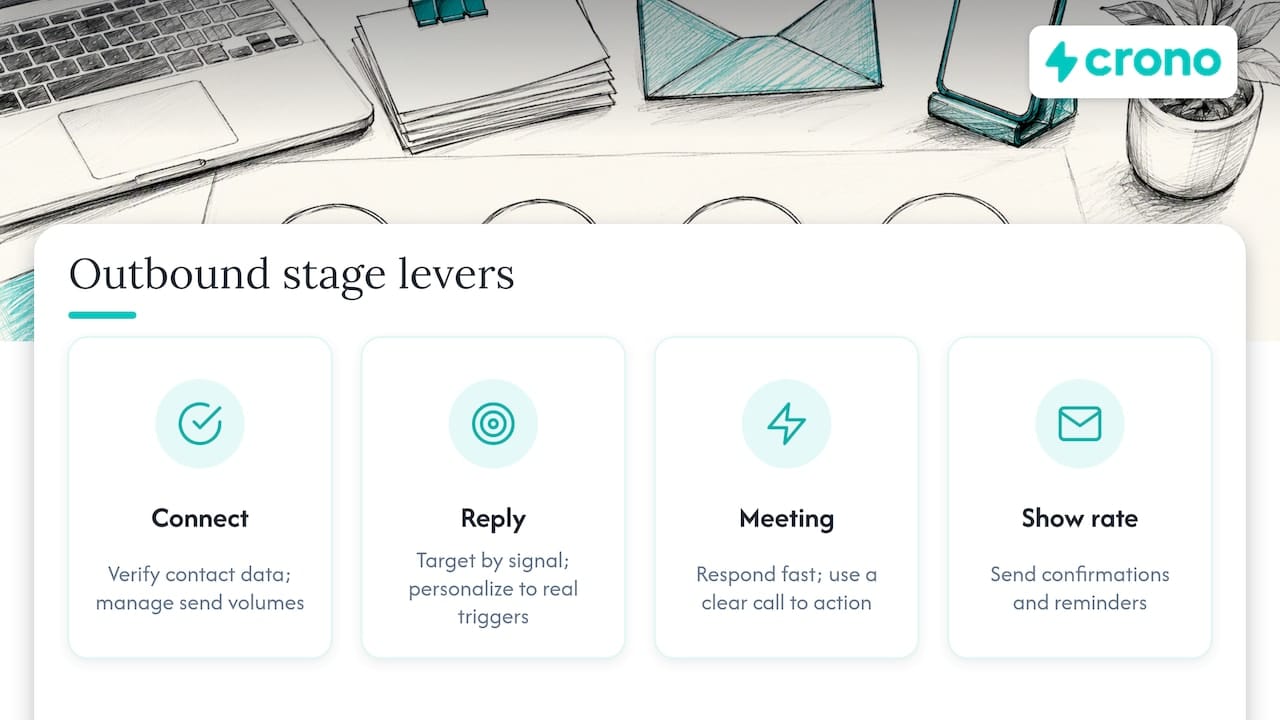
Connect and delivery. Verified contact data, mobile numbers for the right personas and send volumes your domains can handle. Authentication matters here too: our guide on SPF, DKIM and DMARC for operators covers the 60-90 day path to a strict policy.
Reply. Relevance beats volume. Signal-based targeting and personalization tied to a real trigger are the levers. For ranges and tactics on email, see our breakdown of cold email reply rate benchmarks.
Meeting. Speed to respond and a clear call to action. On the phone, the first ten seconds shape the outcome, which we cover in AI openers for cold calling and in our cold call scripts that book meetings.
Show rate. The 68% scheduled-to-attended figure leaves a third of meetings on the table. Confirmations, reminders and a follow-up email after the call recover some of them.
Opportunity and close. Qualification discipline and the handoff between SDR and AE. Prospects who are not ready benefit from lead nurturing strategies that keep them warm until timing changes, instead of being dropped from the funnel.
Our perspective
Most benchmark conversations go wrong because teams compare a headline number to a number measured somewhere else. A reply rate from one dataset and a reply rate from yours rarely share a denominator.
We built Crono as a sales execution layer because the real obstacle is not knowing the benchmark. It is getting clean, comparable stage data out of separate tools. When signals, enrichment, outreach across LinkedIn, email and calls, and pipeline stages sit in one place, your own funnel becomes the benchmark you can trust.
Our advice to sales leaders is simple. Define the stages once, measure each one on the same basis, and spend effort on the stage with the biggest gap. Then let people and AI agents handle the repetitive execution so reps spend their time on conversations.
Alex
Put your own funnel on one page
If your stage numbers live in a CRM, a sequencer and a spreadsheet, the first benchmark to improve is your own reporting. Crono connects your existing CRM and sales tools, with plans from €79 per seat per month on Pro and from €119 per seat per month on Ultra. Teams that want AI agents running prospecting and enrichment can look at the Agentic Sales Engine, which starts at €99 per month for 10,000 credits. You can compare plans on the pricing page or see the Agentic Sales Engine options.
For the bigger picture on how execution fits into planning, our B2B sales plan templates and quota coverage guide for RevOps show how stage rates feed pipeline targets.
FAQ
What are the industry benchmarks for outbound conversion rates?
There are stage-level ranges rather than one number. Recent reports show a median positive reply rate of 1.8%, reply-to-meeting near 14.5%, a show rate near 68% and opportunity-to-close of 15-25% for new business. Enterprise sits lower at 10-20% and SMB higher at 25-35%.
What is the difference between outbound and inbound conversion?
Outbound starts with contacts you chose, who have not asked to hear from you. Inbound starts with people who raised their hands. Because buyer intent differs at the start, compare the two only at a shared point such as a sales-accepted lead or a qualified opportunity.
Is a 2.5% conversion rate good?
It can be. As a cold email positive reply rate it beats the 1.8% median in the data above. As a cold call dial-to-meeting rate it is average. As a meeting-to-opportunity rate it is low. Always name the stage first.
Is a 7% conversion rate good?
As an email response rate it matches the 7.0% observed across 87,015 emails, and as a positive reply rate it is far above the median. As a call connect rate it is typical of one sample and low next to another. For later stages, such as meeting to opportunity, it would usually be below average.
How often should I review my outbound benchmarks?
Review stage rates monthly and by segment, since small samples swing widely week to week. Revisit your stage definitions and contact data at least quarterly, because contact data decays at roughly 2.1% per month.
Sources
- Inbound vs Outbound Sales Funnel Conversion Rates for B2B
- B2B Outbound Benchmarks 2026 (call and email dataset)
- The Sales Angle, week of November 2, 2026
- 2026 B2B Outbound Benchmarks: Real Reply Rates, Meeting Rates
- B2B Outbound Benchmarks 2026: Reply Rates, Conversion
- How to Increase Cold Calling Conversion Rates: A 2026 Guide
- What Is a Good Sales Conversion Rate? Benchmarks by Industry
- Cold Outbound Pipeline Conversion Math
- Appointment Setting Benchmarks 2026: By Stage
