
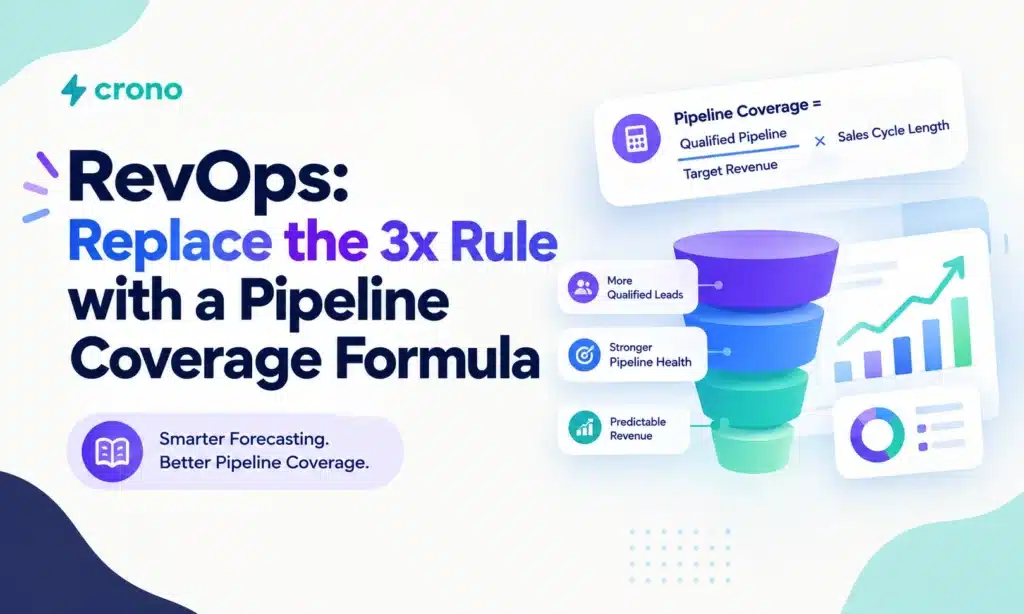
Pipeline coverage ratio equals total qualified pipeline value divided by quota, and the number on its own tells you less than you think. The real work starts when you convert quota into a required pipeline target by dividing it by your effective win rate, or by running it through a stage-probability model. From there, you adjust for deal realization, timing, and segment, because a single multiple rarely fits every part of your funnel.
TL;DR:
- Count only qualified, current opportunities with validated amounts, and match pipeline and quota periods; stale, duplicate, or placeholder deals inflate coverage.
- Use historical win rates for uniform deals with several quarters of consistent data; use stage probabilities when deal sizes or conversion rates vary.
- Subtract eligible carryover from required pipeline before setting weekly or monthly creation targets, and exclude deals that have slipped beyond a reasonable sales cycle.
- Model enterprise, mid market, small business, inbound, and outbound separately, then set coverage bands from historical win rates instead of borrowing a universal benchmark.
Table of Contents
- What Counts as Pipeline, and Why Horizons Must Match
- Worked Examples: Running the Numbers Quarterly and Annually
- Adjusting for Win Rate, Deal Shrinkage, and Stage Probability
- Carryover vs. New Pipeline: Timing the Target Correctly
- Why One Multiple Doesn’t Fit Every Segment
- What Counts as Healthy Coverage, and Where Benchmarks Mislead
- Keeping the Target Current: Cadence and Early Warning Signs
- Coverage math tells you how much pipeline you need. It doesn’t tell you how to generate or convert it efficiently, and that’s where execution work matters as much as planning. Our platform is designed to orchestrate prospecting, enrichment, and multichannel outreach in one place, helping RevOps teams spend less time stitching together disconnected tools and more time acting on the segments where coverage is thinnest. Teams usually see the biggest gains from better prioritization of which accounts to work first and faster execution on outreach sequences once a gap is identified, rather than from any single feature. For a deeper look at building the pipeline infrastructure behind these numbers, see why brands should use SaaS SEO for sustainable growth that details measurement and dashboarding approaches relevant to pipeline and marketing measurement.
- FAQ
- Sources
What Counts as Pipeline, and Why Horizons Must Match
The raw formula is simple: pipeline coverage = total qualified pipeline value ÷ quota. The hard part is making sure both sides of that equation measure the same thing.
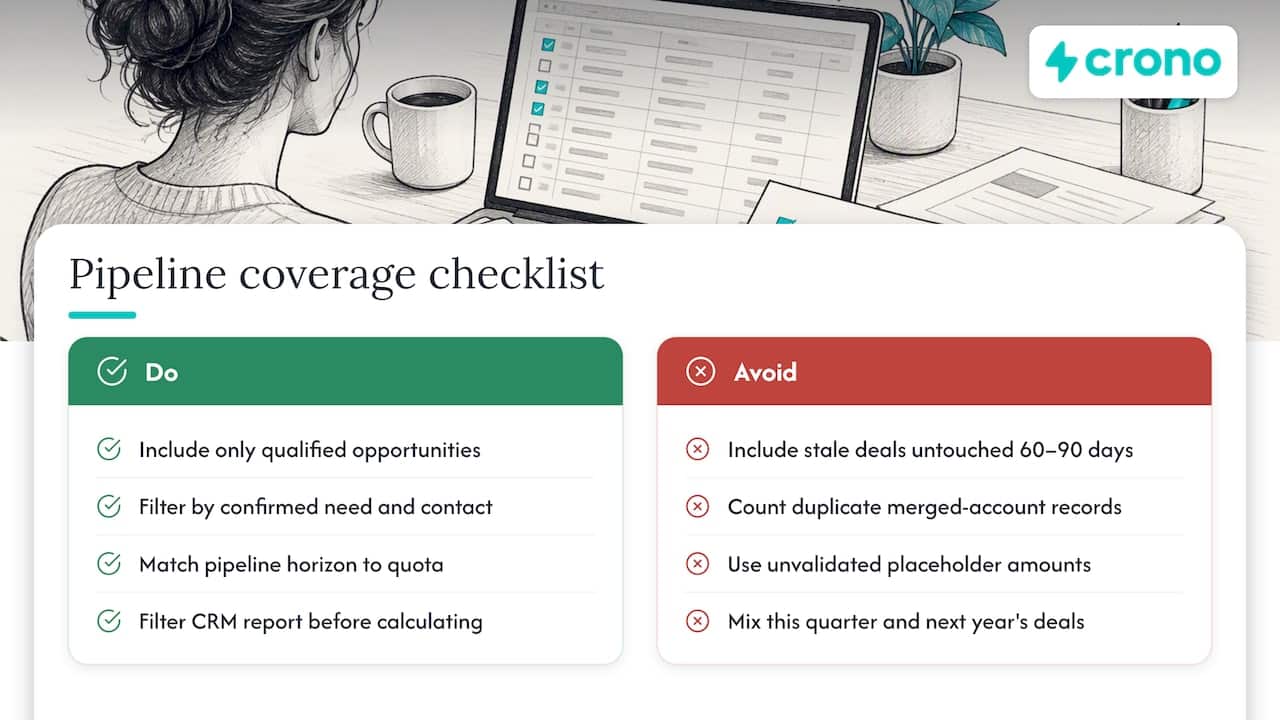
“Qualified pipeline” should include only opportunities that have passed your defined qualification stage, meaning a real contact, a confirmed need, and an estimated close date. Exclude stale deals sitting untouched for 60 or 90 days, duplicate records from merged accounts, and opportunities with placeholder amounts that nobody has validated. These inflate the numerator and make coverage look healthier than it is.
Quota needs the same scrutiny. Define whether you’re measuring a rep’s quota, a team’s, or a segment’s, and make sure the time horizon on the pipeline side matches the time horizon on the quota side. A quarterly quota needs quarterly pipeline, not a mix of this quarter’s deals and next year’s early-stage leads. An annual quota requires annual pipeline, built from total expected closes across all four quarters, not a snapshot taken once in January. Mismatched horizons are one of the most common reasons coverage numbers get flagged as wrong in planning meetings, and fixing them is usually a matter of filtering your CRM report correctly before you calculate anything.
Worked Examples: Running the Numbers Quarterly and Annually
Seeing the formula applied to real numbers makes the adjustments later in this article easier to follow.
- Quarterly example. Say a team has a $500,000 quota for the quarter and a historical win rate of 25%. Required pipeline = $500,000 ÷ 0.25 = $8,000,000. If the CRM shows $1,800,000 in qualified pipeline, coverage sits at 3.6x, just under the required 4x implied by that win rate.
- Annual example with carryover. Say annual quota is $8,000,000, average contract value is $40,000, and the sales cycle runs 90 days. Expected deals needed for the year: 50. If win rate holds at 25%, required pipeline is $8,000,000 across the year, but deals opened in Q4 of the prior year that haven’t closed yet count as carryover and reduce what needs to be created fresh in Q1.
- Contrast with a flat multiple. Apply a generic 3x rule to the quarterly example above and you’d target $1,500,000 in pipeline, which is $500,000 short of what the win-rate-based formula actually requires. The flat multiple would have told this team they were covered when they were not.
Adjusting for Win Rate, Deal Shrinkage, and Stage Probability
The raw division of quota by win rate assumes every dollar in pipeline is equally likely to close, which is rarely true. Two methods fix that.
- Historical win rate works well when your pipeline is relatively uniform in deal size and stage, and when you have at least a few quarters of consistent data.
- Stage-to-stage conversion works better when deals vary widely in size or when your funnel has distinct stages with different drop-off rates. This method multiplies the probability of closing from each stage by the value sitting in that stage, then sums the results.
- Deal-realization haircuts account for late-stage shrinkage, where deals that make it to the final stage still close smaller than originally forecast or slip to a later period.
A simple table shows how these adjustments stack:
Pro Tip: Run both the win-rate method and the stage-probability method side by side for one quarter before retiring either one. The gap between them usually tells you where your qualification criteria need tightening.
Carryover vs. New Pipeline: Timing the Target Correctly
Not every dollar in your required pipeline needs to be created from scratch inside the current period. Some of it already exists as carryover from deals opened earlier that are still working their way through the funnel.
- Define carryover pipeline as open opportunities from prior periods still inside their expected close window, not deals that have already slipped past a reasonable cycle length.
- Estimate new creation need by subtracting carryover value from total required pipeline, then dividing the remainder by your average sales-cycle length to see how much must be generated per week or month to stay on pace.
- Apply the split formula: new pipeline needed = required pipeline, total minus carryover pipeline, available. If required pipeline is $8,000,000 and $600,000 carries over from last quarter, the team needs to create $1,400,000 in new qualified opportunities within the quarter.
Getting this split wrong is a common planning error: teams count carryover twice, once in last quarter’s numbers and again in this quarter’s, which overstates how much new pipeline generation is actually needed.
Why One Multiple Doesn’t Fit Every Segment
A single coverage multiple applied across an entire book of business hides more than it reveals, because win rates and deal sizes rarely look the same across segments. The Duke Entrepreneurship Manual’s sales planning framework breaks revenue down as the number of prospects multiplied by probability of winning multiplied by average revenue per deal, and that decomposition is the foundation for segment-level modeling rather than one blanket ratio.
Practically, this means building two to four segments rather than treating pipeline as one pool:
- Enterprise deals tend to have lower win rates and longer cycles but much higher average contract value, requiring higher coverage multiples to compensate for conversion risk.
- Mid-market deals usually sit in the middle on both win rate and deal size, often the segment where historical data is most reliable.
- Small or SMB deals often close faster and at higher win rates, meaning they need less coverage relative to quota than enterprise deals do.
- Inbound vs. outbound splits matter too, since inbound-sourced opportunities typically convert at a different rate than outbound-sourced ones, even within the same segment.
Once you calculate required pipeline separately for each bucket using that segment’s own win rate and average contract value, you add the segment totals together to get an organization-wide number that actually reflects how the business converts, rather than a single ratio borrowed from an industry blog post.
What Counts as Healthy Coverage, and Where Benchmarks Mislead
A team with a 30-day cycle and small deal sizes can often run closer to the low end, while a team selling six-figure enterprise contracts over a nine-month cycle usually needs to run toward the high end.
Rather than adopting one number, build three bands: a lower bound based on your weakest historical win rate, a prudent target based on average performance, and a stretch target that assumes modest improvement in conversion. Treat any benchmark multiplier as a sanity check, not a planning input, since copying a number from a calculator page without adjusting for your own segment mix and cycle length tends to produce targets that look reasonable but don’t hold up against your actual close rates.
Keeping the Target Current: Cadence and Early Warning Signs
A coverage number calculated once at the start of a quarter goes stale fast. Treat it as a living figure that gets checked on a schedule, not a one-time calculation.
- Weekly hygiene checks: scrub for aging deals past their expected close date, duplicate records, and opportunities missing a validated amount or next step.
- Monthly recalculation: rerun the coverage formula with updated win rates and current pipeline value, since both drift over a quarter.
- Quarterly resets: rebuild the required pipeline target from scratch using the most recent four to six quarters of win-rate and deal-size data, rather than carrying forward last quarter’s assumptions.
Watch four signals between recalculations: pipeline age distribution, stage-to-stage conversion rates, any drift in win rate up or down, and the velocity at which new qualified pipeline is being created. When coverage comes up short, the fastest remedies are usually reallocating rep capacity toward highest-probability segments, tightening qualification criteria so stale deals stop inflating the numerator, and pulling forward prospecting activity in the segments with the shortest sales cycles.
Pro Tip: When coverage is short with four weeks left in the quarter, prioritize stage-advancement on existing late-stage deals over generating brand-new top-of-funnel pipeline. New deals rarely close in time to help the current period.
Coverage math tells you how much pipeline you need. It doesn’t tell you how to generate or convert it efficiently, and that’s where execution work matters as much as planning. Our platform is designed to orchestrate prospecting, enrichment, and multichannel outreach in one place, helping RevOps teams spend less time stitching together disconnected tools and more time acting on the segments where coverage is thinnest. Teams usually see the biggest gains from better prioritization of which accounts to work first and faster execution on outreach sequences once a gap is identified, rather than from any single feature. For a deeper look at building the pipeline infrastructure behind these numbers, see why brands should use SaaS SEO for sustainable growth that details measurement and dashboarding approaches relevant to pipeline and marketing measurement.
Coverage math tells you how much pipeline you need. It doesn’t tell you how to generate or convert it efficiently, and that’s where execution work matters as much as planning. Our platform is designed to orchestrate prospecting, enrichment, and multichannel outreach in one place, helping RevOps teams spend less time stitching together disconnected tools and more time acting on the segments where coverage is thinnest.
Teams usually see the biggest gains from better prioritization of which accounts to work first and faster execution on outreach sequences once a gap is identified, rather than from any single feature. For a deeper look at building the pipeline infrastructure behind these numbers, the sales pipeline guide covers stages and hygiene in more depth, and the piece on replacing the universal 3x rule walks through segment-level quota planning step by step.
FAQ
What is a good pipeline coverage ratio?
A more reliable approach is to calculate required coverage from your own win rate rather than adopting an industry average.
What is the formula to calculate pipeline throughput?
Pipeline throughput generally refers to the rate at which opportunities move through stages toward closed revenue over a given period, distinct from the coverage ratio itself. Most teams track it through stage-conversion rates and average time-in-stage rather than a single formula, since the calculation varies by how a sales process is structured.
What percentage of pipeline should come from marketing?
This varies significantly by business model, go-to-market motion, and segment, and no universal percentage applies across industries. Segment-level modeling, tracking inbound and outbound pipeline separately, gives a far more accurate picture than assuming a fixed marketing-sourced share.
What are pipeline metrics?
Pipeline metrics are the set of measurements used to evaluate funnel health, including pipeline coverage ratio, win rate, sales velocity, and stage-to-stage conversion rates. Tracking coverage alongside these other metrics, rather than in isolation, gives a clearer read on whether a shortfall is a volume problem or a conversion problem.
